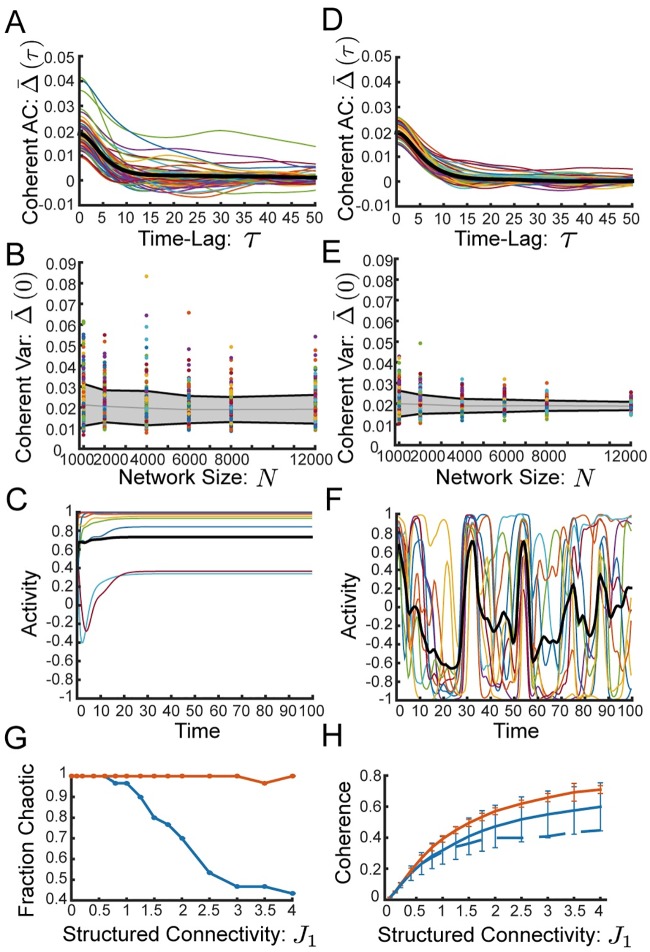
Fig 2. Row balance preserves chaos, and increases coherence.
(A) Full coherent mode autocorrelation, of 60 individual realizations. Thick black line shows average over realizations. Network with random connectivity J without row balance exhibits significant difference between realizations. (B) Coherent mode variance, , as a function of network size for 300 individual realizations. Gray line shows average and gray region with black boundary shows one standard deviation over realizations. Without row balance the standard deviation (over realizations) saturates to a finite value as the network size increases, indicating that the variability between realizations is not a finite-size effect. (C) Without row balance a network with moderate structured connectivity (J1 = 2.5) exhibits a fixed point. (D)-(F) Same as (A)-(C) respectively, but network has “row balance” random connectivity, . (D) Individual realizations of Δ(τ) are all very close to the average. (E) With row balance the standard deviation of Δ(0) over realizations shrinks with N, suggesting that the variability between realizations is a finite-size effect. (F) Same realization of J as in (C), but with row balance. Chaos is preserved. (G)-(H) Networks without row balance in blue, with row balance in red (G) Fraction of realizations (out of 30 realizations) that lead to chaotic dynamics, as a function of structural connectivity, J1. Row balance keeps nearly all realizations chaotic. (H) Coherence, χ, as a function of J1 computed for the realizations from (E). Row balance increases coherence. Error bars display standard deviation. Full line shows all realizations, dashed line displays average coherence restricted to the chaotic realizations. J1 = 0.2, g = 2, and N = 4000 for all panels unless otherwise noted.

