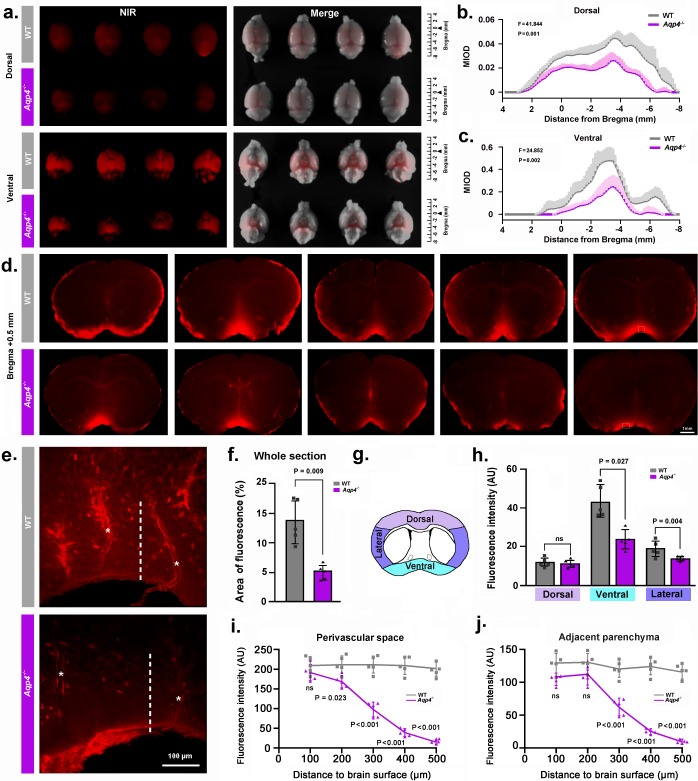
Figure 2. NMU: Aqp4 gene deletion reduced the penetration of intracisternally injected tracer into the brain parenchyma.
Texas Red-conjugated dextran (TRd3, 3kD) was injected intracisternally into WT and Aqp4 KO mice. Thirty minutes after injection, the anesthetized animals were perfusion fixed, and the fluorescence was evaluated ex vivo. (a) Representative near infrared (NIR) fluorescence images of the dorsal and ventral whole-brains of four mice per genotype. (b-c) Quantification of the mean integrated optical density (MIOD) of TRd3 on the dorsal (b) and ventral (c) brain surface of WT (grey) and Aqp4 KO (purple) mice from 4.0 mm anterior to 8.0 mm posterior to bregma. (d) Representative images of coronal brain sections at +0.5 mm from bregma from five pairs of WT and Aqp4 KO mice showing TRd3 distribution within the brain. (e) High magnification micrographs of the hypothalamus (lined area in d) showing the fluorescence intensity of TRd3 within the perivascular space (star) and adjacent brain parenchyma (dotted line) of WT mice and Aqp4 KO mice, respectively. (f) Quantification of the percentage area of whole-slice fluorescence of the both genotypes for 6–8 forebrain sections (+1.7 to −0.7 mm from bregma) of each mouse. (g) Diagram showing the subregional analysis of brain sections at the level of 0.5 mm anterior to bregma. (h) Quantification of the mean fluorescence intensity (AU, arbitrary units) of TRd3 of the dorsal, ventral and lateral brain regions, respectively. (i-j) Quantification of the mean fluorescence intensity of TRd3 along the perivascular space and the interstitium adjacent to the vessels under the ventral surface of the hypothalamus of the both genotypes. Shades and error bars represent standard deviation. Data in Figure 2b and c were analyzed by repeated-measures ANOVA, N = 4 per group. Data in Figure 2f,h,i and j were analyzed by Student’s t-test. p-Values shown are comparisons between WT and Aqp4-/-. ns: not significant (Figure 2—source data 1).

