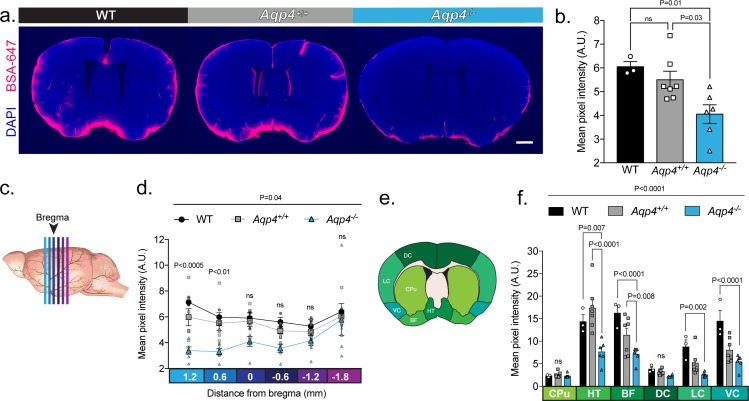
Figure 4. UNC: CSF tracer influx is decreased in Aqp4 KO mice.
(a) Coronal sections from a C57BL/6 wild-type mouse (WT), CD1 background strain control (Aqp4+/+), and Aqp4 KO mice (Aqp4-/-) showing a fluorescent CSF tracer, BSA-647 and co-labeling with DAPI. Scale bar: 1 mm (b) Mean pixel intensity in arbitrary units (A.U.) for six brain sections of each mouse for all three groups. n = 3 (WT), 7 (Aqp4+/+), 6 (Aqp4-/-). One-way ANOVA Tukey’s multiple comparisons test, Interaction term: p = 0.0110, F = 6.512, ns: not significant. (c) Diagram showing the anterior-posterior range of the quantified coronal sections relative to bregma from (b). (d) Quantification of the slices shown in (c) + 1.2 to −1.8 mm from bregma. Repeated measures two-way ANOVA with Tukey’s multiple comparisons test, Interaction term: p = 0.038, F = 2.085, p values shown are comparisons of WT and Aqp4+/+ vs. Aqp4-/-. (e) Diagram depicting the ROIs included in the regional analysis of brain slices at +0.6 mm from bregma. CPu: caudoputamen; HT: hypothalamus; BF: basal forebrain; DC: dorsal cortex; LC: lateral cortex; VC: ventral cortex. (f) Mean pixel intensity of brain regions shown in (e) for coronal sections + 0.6 mm from bregma. Repeated measures two-way ANOVA Tukey’s multiple comparisons test, Interaction term: p < 0.0001, F = 8.109. Data is presented as mean ±SEM (Figure 4—source data 1).

