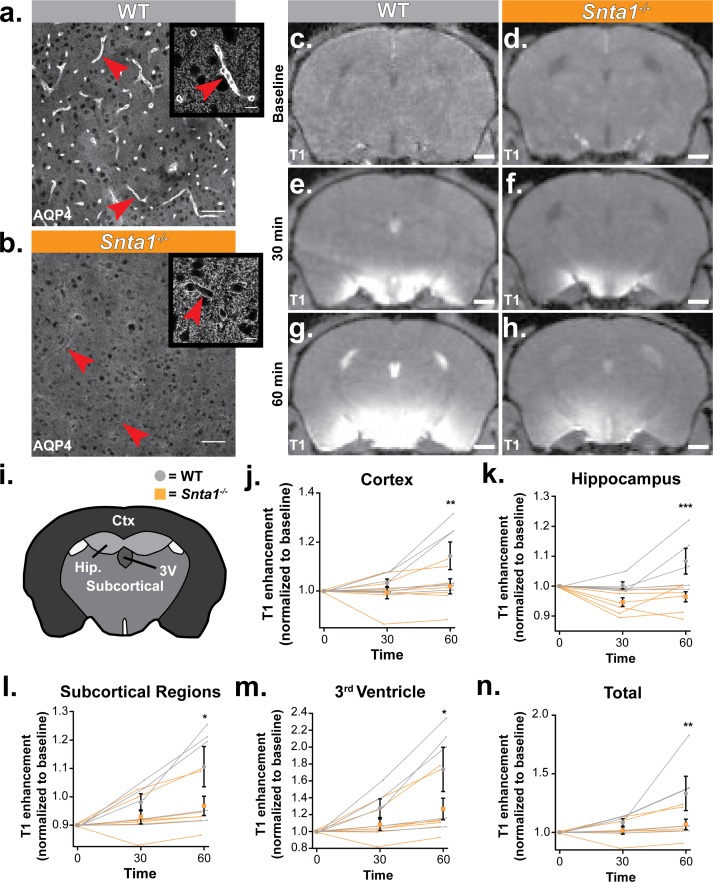
Figure 6. Deletion of the adapter protein α-syntrophin impairs AQP4 perivascular localization, and CSF influx into the brain parenchyma.
Dynamic contrast enhanced magnetic resonance imaging (DCE-MRI) was acquired on a 11.75 preclinical MRI scanner, and was used to characterize the effect of α-syntrophin deletion on gaditeridol influx into the brain. Representative images of AQP4 perivascular localization in wild-type mice (a), and the loss of perivascular localization of AQP4 seen in the Snta1-/- mice (b). Scale bar: 50 µm, inset scale bar: 10 µm. (c-h) Coronal slice of T1-weighted images acquired by DCE-MRI demonstrate the reduced influx of gaditeridol contrast agent into the parenchyma in Snta1-/- mice relative to wild-type mice at 30 and 60 min. Scale bar: 1 mm. (i-n) Quantification of T1 weighted signal in various brain subregions normalized to baseline at each time point. Traces for each individual animal are presented (lines) along with the summary statistics (mean ±SEM, two-way ANOVA). WT n = 5, ASYNKO n = 7. CTx = cortex (p = 0.0035) Hip = hippocampus (p = 0.0003) Subcortical = subcortical regions (p = 0.0185) 3V = 3rd Ventricle (p = 0.0284) Total (p = 0.0085) (Figure 6—source data 1).

