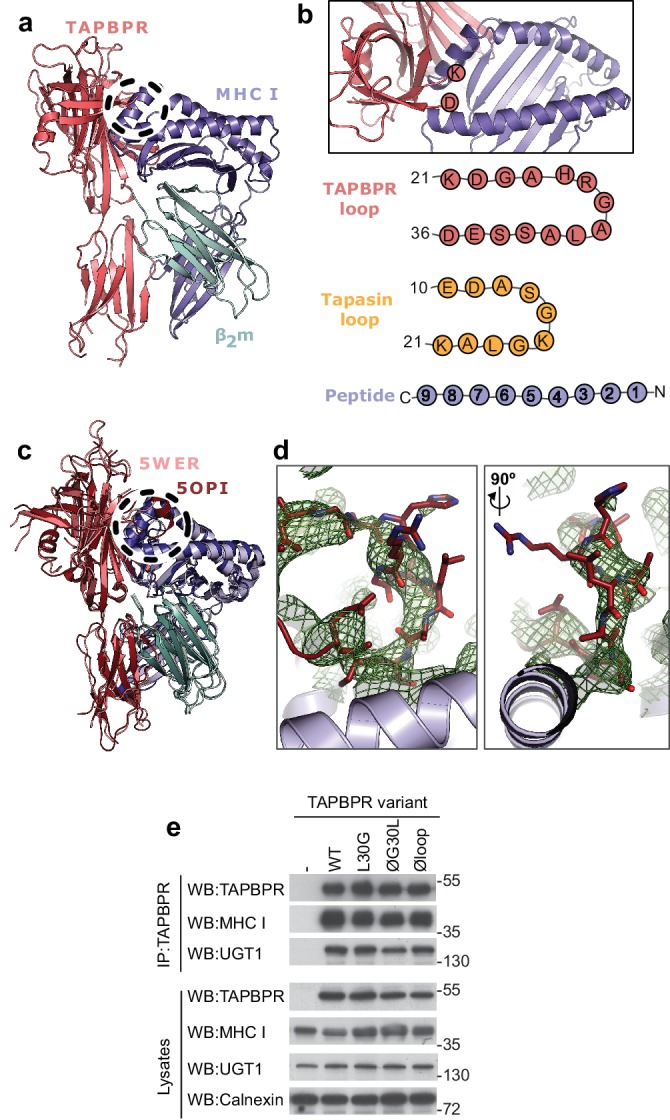
Figure 1. TAPBPR loop interactions with MHC I.

(a) Model of TAPBPR (pink) docked onto MHC I (blue) and β2m (cyan) based on interaction studies (Hermann et al., 2013). (b) Top panel, illustration of the proximity of the TAPBPR loop region to the peptide binding groove (viewed from the top of complex shown in panel a). Lower panel, schematic diagrams of the amino acid composition of the TAPBPR and tapasin loops compared to the length and orientation of a peptide. (c) Overlay of two recent X-ray structures of TAPBPR in complex with MHC I (Jiang et al., 2017; Thomas and Tampé, 2017) (PDB ID 5WER and 5OPI) oriented and coloured to illustrate the similarity to our TAPBPR:MHC I complex (panel a). The position of the TAPBPR loop is circled (black dashed line). (d) The electron density map (2Fo-Fc, green mesh) and the built model (maroon sticks, residues D23-E34) are shown for the loop region of TAPBPR (PDB ID 5OPI). Two views of the loop and density are shown rotated by 90 degrees. (e) Expression of TAPBPR loop variants in IFNγ treated HeLaM-TAPBPRKO and their interaction with MHC I and UGT1. Western blotting for calnexin is included as a loading control. Representative of three independent experiments.
