. 2018 Nov 28;7:e40126. doi: 10.7554/eLife.40126

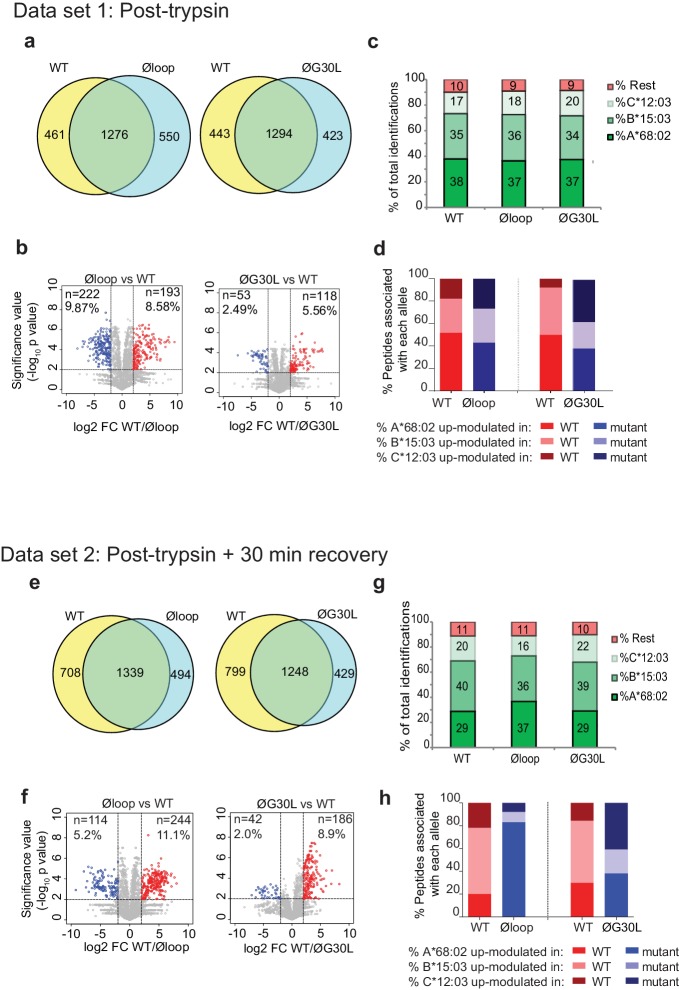
Figure 5. Mutation of the K22-D35 loop of TAPBPR changes the peptide repertoire presented on cells.

Peptides eluted from W6/32-reactive MHC I complex isolated from IFNγ treated HeLaM-TAPBPRKO expressing either TAPBPRWT, TAPBPRØloop or TAPBPRØG30L were analysed using LC-MS/MS. In dataset 1 (a–d), cells were frozen immediately post-trypsination while in dataset 2 (e–h) cells were allowed to recover in media for 30 min after trypsination, before freezing. The sequences of identified peptides are listed in Figure 5—source datas 27. The comparison of all five technical replicates for the two datasets is shown in Figure 5—figure supplement 1. (a,e) Venn diagrams compare all the identified peptides using a presence/absence approach. (b,f) Volcano plots graphically summarise label-free quantitation, displaying modulated peptides between two cells lines. Colour circles highlight the peptide which are differentially expressed between two cell lines after applying an adjusted p-value of <0.01. The list of these peptides is available in Figure 5—source datas 8 and 9. n = number of significantly modulated peptides, % demonstrates the fraction of significantly modulated peptides in a specific cell line compare to all peptides in the comparison. (c,d,g,h) Bar graphs summarise the MHC I molecules (HLA-A*68:02, -B*15:03 or –C*12:03) that the (c,g) identified peptides in a/e, and (d,h) the significantly modulated peptides identified in b/f were matched to using the NetMHCpan-4.0. In (c) and (g), peptides not successfully assigned are indicated in orange (rest). Analysis of the peptide repertoire from a further TAPBPR-loop mutant lacking L30 and from a third biological repeat can be found in Figure 5—figure supplements 2 and 3 respectively. Analysis of the predicted affinity of peptides differential modulated upon mutation of the loop (i.e those in b) and (f) can be found in Figure 5—figure supplement 4.

Figure 5—source data 1. Binding of TAPBPR to the individual HLA molecules found in HeLaM cells.
Soluble TAPBPRWT or soluble TAPBPRØloop were incubated with the indicated LABScreen single antigen HLA class I beads (from One Lambda, Canoga Park, California) for 60 min at RT. After washing 3 times in PBS, bound TAPBPR was detected using the TAPBPR-specific mAb PeTe4 and a goat anti-mouse PE-conjugated secondary antibody. Samples were analysed using the Luminex Fluoroanalyser system. The table shows the MFI of PeTe4 staining ± SD for the indicated HLA beads incubated in the absence and presence of 1 µM of TAPBPRWT or TAPBPRØloop. The expression of MHC I (detected using W6/32) provided by One Lambda for the specific lot of LABScreen beads used is included as a control.
DOI: 10.7554/eLife.40126.014
Figure 5—source data 2. Dataset 1 - peptides eluted from W6/32-reactive MHC I complexes from IFNγ treated HeLaM-TAPBPRKO cells expressing TAPBPRWT.
elife-40126-fig5-data2.xlsx (277.7KB, xlsx)
DOI: 10.7554/eLife.40126.015
Figure 5—source data 3. Dataset 1 - peptides eluted from W6/32-reactive MHC I complexes from IFNγ treated HeLaM-TAPBPRKO cells expressing TAPBPRØloop.
elife-40126-fig5-data3.xlsx (291.6KB, xlsx)
DOI: 10.7554/eLife.40126.016
Figure 5—source data 4. Dataset 1 - peptides eluted from W6/32-reactive MHC I complexes from IFNγ treated HeLaM-TAPBPRKO cells expressing TAPBPRØG30L.
DOI: 10.7554/eLife.40126.017
Figure 5—source data 5. Dataset 2 - peptides eluted from W6/32-reactive MHC I complexes from IFNγ treated HeLaM-TAPBPRKO cells expressing TAPBPRWT.
elife-40126-fig5-data5.xlsx (268.8KB, xlsx)
DOI: 10.7554/eLife.40126.018
Figure 5—source data 6. Dataset 2 - peptides eluted frm W6/32-reactive MHC I complexes from IFNγ treated HeLaM-TAPBPRKO cells expressing TAPBPRØloop.
elife-40126-fig5-data6.xlsx (306.8KB, xlsx)
DOI: 10.7554/eLife.40126.019
Figure 5—source data 7. Dataset 2 - peptides eluted from W6/32-reactive MHC I complexes from IFNγ treated HeLaM-TAPBPRKO cells expressing TAPBPRØG30L.
elife-40126-fig5-data7.xlsx (279.8KB, xlsx)
DOI: 10.7554/eLife.40126.020
Figure 5—source data 8. Dataset 1 - analysis of eluted peptides used to generate volcano plots.
DOI: 10.7554/eLife.40126.021
Figure 5—source data 9. Dataset 2 - analysis of eluted peptides used to generate volcano plots.
DOI: 10.7554/eLife.40126.022
Figure 5—source data 10. Peptides eluted from W6/32-reactive MHC I complexes from IFNγ treated HeLaM-TAPBPRKO cells expressing TAPBPRM29.
DOI: 10.7554/eLife.40126.023
Figure 5—source data 11. Dataset 3 - peptide list for third biological repeat for TAPBPRWT expressing cells.
DOI: 10.7554/eLife.40126.024
Figure 5—source data 12. Dataset 3 - peptide list for third biological repeat for TAPBPRØloop expressing cells.
DOI: 10.7554/eLife.40126.025
Figure 5—source data 13. Dataset 3 - peptides list for third biological repeat for TAPBPRØG30L expressing cells.
DOI: 10.7554/eLife.40126.026

Figure 5.

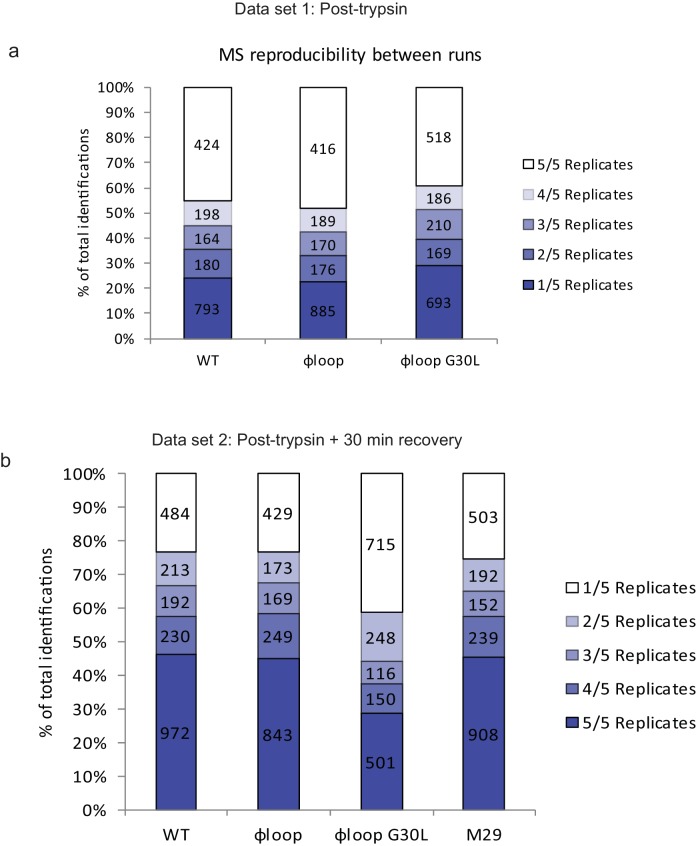
Figure 5—figure supplement 1. Technical reproducibility of LC-MS/MS measurement.

Figure 5—figure supplement 1.

Peptide elution experiments were performed in five technical replicates for all cell lines. Column analysis reveals the percentage of peptides identified in 1–5 out of 5 technical replicates for (a) dataset 1 (cells frozen immediately post-trypsinisation) and (b) dataset 2 (cells allowed to recover for 30 min in media post-trypsinisation before freezing).
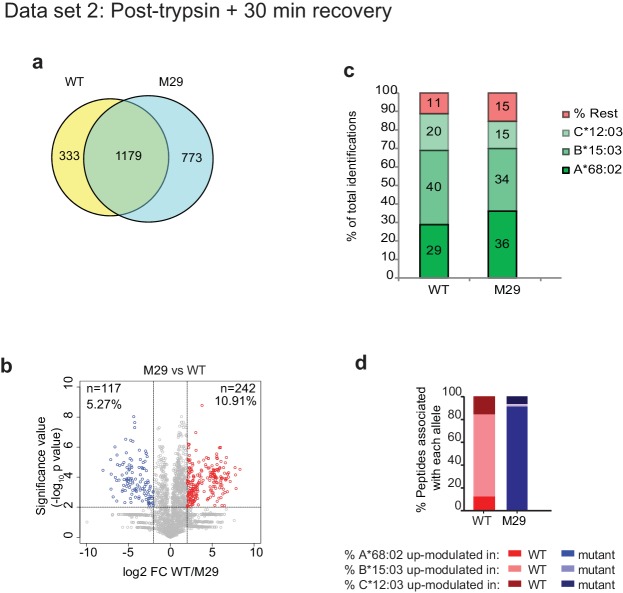
Figure 5—figure supplement 2. Mutation of residue A29-D35 in the loop of TAPBPR changes the peptide repertoire presented on cells.

Figure 5—figure supplement 2.

In addition to the TAPBPRWT, TAPBPRØloop or TAPBPRØG30L analysed in Figure 5e–h, we also performed peptidomic analysis for an additional loop mutation of TAPBPR in which residues A29-D35 where mutated from ALASSED to GGSGGAA (TAPBPRM29). Thus, this mutant also lacks the leucine 30 residue. Peptides eluted from W6/32-reactive MHC I complex isolated from IFNγ-treated HeLaM-TAPBPRKO expressing either TAPBPRWT and TAPBPRM29 were analysed using LC-MS/MS as in dataset two in Figure 5 (with recovery in media for 30 min after trypsination, before freezing). The sequences of identified peptides for TAPBPRM29 are listed in Figure 5—source data 10. (a) Venn diagrams compare all the identified peptides using a presence/absence approach. (b) Volcano plots graphically summarise label-free quantitation, displaying modulated peptides between two cells lines. Colour circles highlight the peptide which are differentially expressed between two cell lines after applying an adjusted p-value of <0.01. n = number of significantly modulated peptides, % demonstrates the fraction of significantly modulated peptides in a specific cell line compare to all peptides in the comparison. (c) Bar graphs summarise the MHC I molecules (HLA-A*68:02, -B*15:03 or –C*12:03) that the (c) identified peptides in (a) and (d) the significantly modulated peptides identified in (b) and were matched to using the NetMHCpan-4.0. In c, peptides not successfully assigned are indicated in orange (rest).
Figure 5—figure supplement 3. 3rd biological repeat.
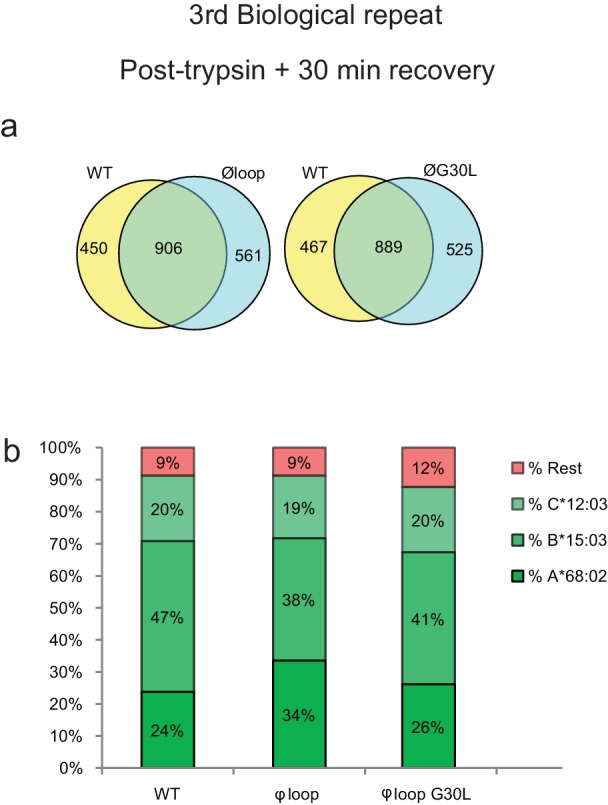
Figure 5—figure supplement 3.

Peptides were eluted from W6/32-reactive MHC I complexes isolated from a third set of IFNγ treated HeLaM-TAPBPRKO expressing either TAPBPRWT, TAPBPRØloop or TAPBPRØG30L and analysed using LC-MS/MS. The treatment of these cells is comparable to dataset two in the main Figure 5 (cells were allowed to recover in media for 30 min after trypsination, before freezing. The sequences of identified peptides are listed in Figure 5—source datas 1113. The dataset is based on three technical repeats. (a) Venn diagrams compare all the identified peptides using a presence/absence approach. (b) Bar graphs summarise the MHC I molecules (HLA-A*68:02, -B*15:03 or –C*12:03) that the identified peptides in (a) were matched to using the NetMHCpan-4.0. In (b), peptides not successfully assigned are indicated in orange (rest). As shown in Figure 5e and g, this additional dataset suggests that TAPBPR molecules with a function loop strips peptides from HLA-A*68:02 molecules.
Figure 5—figure supplement 4. Peptide affinity predictions using NetMHC.

Figure 5—figure supplement 4.

The affinity of peptides identified as being differentially modulated in the Volcano plots in
Figure 5b and f) were predicted using netMHCpan3.0. For each comparisons the peptides were sorted into the A-/B-/C-alleles using best_NetMHC_Allele. Peptides with an affinity above 500 nM were excluded. Box and whiskers plots show the peptide affinities for HLA-A*68:02, -B*15:03 and C*12:03 for peptides differentially modulated in (a) dataset one and (b) dataset 2. As the data-points were not normally distributed, the Mann-Whitney test was used to find significant differences between the comparisons. The number of peptides used in the analysis is show below each graph. We feel it is very difficult to draw any definitive conclusions regarding the effect of mutating the loop on the affinity of the peptides bound to MHC I from this particular analysis. Firstly, the peptide numbers corresponding to each HLA is low, especially for the HLA-B15 assigned peptides from cells expressing the TAPBPR loop mutant. This questions whether the significance observed is reliable, particularly for HLA-B15. Secondly, our experimental design was set up to explore whether there was a global change in peptide repertoire upon mutation of the TAPBPR loop. Thus, technical limitations regarding the need to assign peptides to particular MHC I (by applying thresholds or cut-offs to determine which peptide was bound to which MHC I) greatly reduce the ability to detect peptides exhibiting low affinity for a particular MHC I. Other studies (Garstka et al., 2015; Kanaseki et al., 2013; Nagarajan et al., 2016), exploring the affinity of peptides by immunopeptidomics use cells expressing only one MHC I. Therefore, the identified peptides do not need to be assigned to MHC I, thus improving the ability to see reliable changes (including subtle changes) in anchors and affinity. A third consideration is that trypsination of cells may be cause the loss of low-affinity peptide from MHC I molecules. One interesting observation from this analysis was the affinity of HLA-A*68:02 assigned peptides between dataset 1 and dataset two for cells expressing TAPBPRWT appeared to increase. Thus hinting that surface expressed TAPBPRWT may dissociate low-affinity peptide from HLA-A*68:02. However, to conclude, from these particular datasets, we are unable to address whether there is any change in affinity of MHC I bound peptides upon mutation of the TAPBPR loop. Improvement in experimental design will address this in the future.