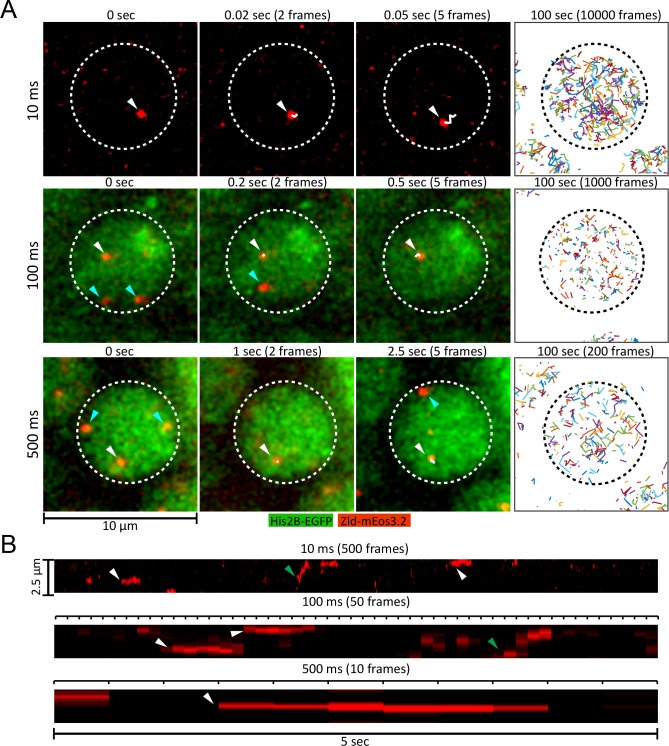
Figure 1. Live embryo single-molecule imaging and tracking of endogenous mEos3.2-Zld.
(A) First three columns are example images showing single molecules of mEos3.2-Zld tracked over at least five frames (white arrows and trajectories) at frame rates of 10, 100 and 500 ms. Cyan arrows indicate molecules that appear for only one frame and are thus detected but not tracked. For the 100 and 500 ms data, enough signal is present in the His2B-eGFP channel from the 405 nm activation laser to enable simultaneous imaging of chromatin. Last column shows all single-molecule trajectories acquired in each nucleus over 100 s, corresponding to 539, 263, and 186 trajectories over 10000, 1000, and 200 frames for the 10, 100 and 500 ms data, respectively. Dotted lines indicate the boundary of a nucleus. Contrast was manually adjusted for visualization. (B) Representative kymographs over 5 s of imaging, corresponding to 500, 50, and 10 frames for the 10, 100 and 500 ms frame rate data, respectively. Green arrows point to molecules that display relatively large motions, and white arrows to immobile molecules.


