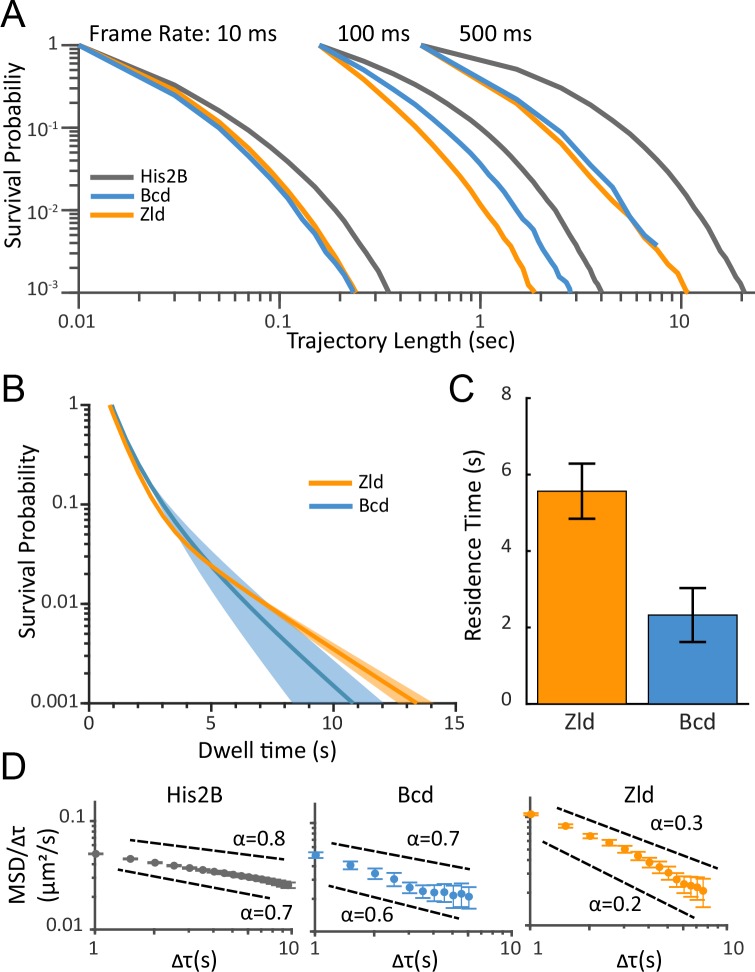
Figure 4. Residence times and dynamics of bound Zld and Bcd molecules.
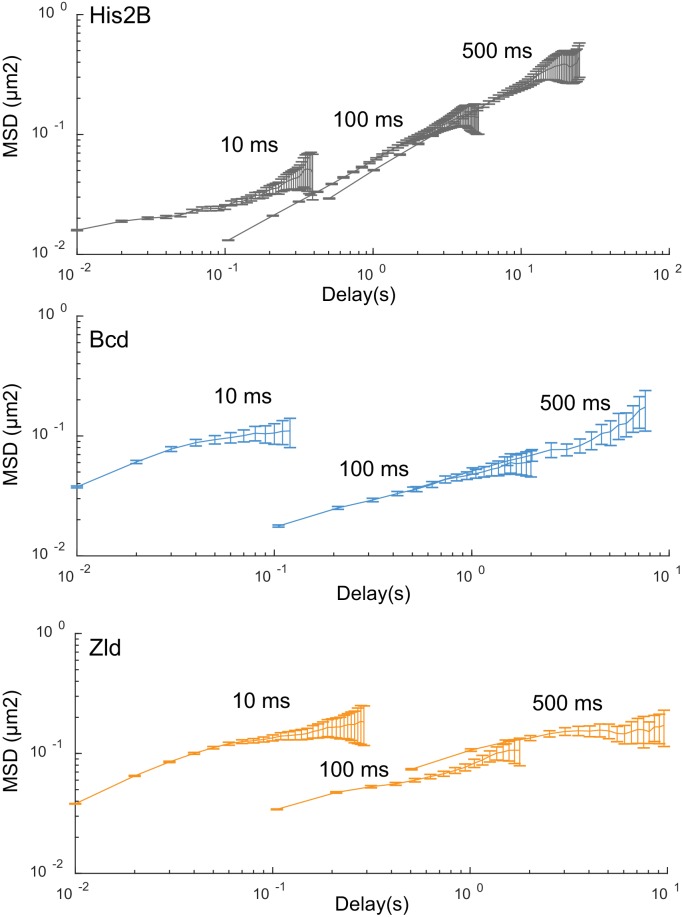
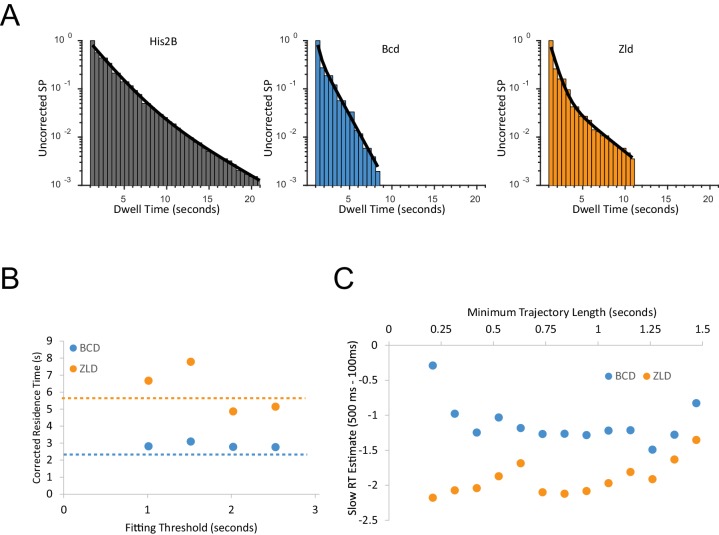
(A) Raw survival probabilities of trajectories at all frame rates. Calculated over 77869, 81660, 11003, at 10 ms, 107998, 42698, 8990 at 100 ms, and 2420, 14487, 47681 at 500 ms, trajectories for His2B, Zld, and Bcd respectively. (B) Uncorrected two-exponent fits to the survival probability distributions obtained from the 500 ms frame rate data. Dark solid lines are the mean over fits from three embryos and the shaded regions indicate the standard error. (C) Bias corrected quantification of the slow residence times for Zld (5.56 ± 0.72 s) and Bcd (2.33 ± 0.71 s). Error bars indicate standard error over three embryos for a total of 188 and 171 nuclei for Bcd and Zld, respectively. (D) MSD/τ curves for His2B, Bcd, and Zld at 500 ms frame rates plotted on log-log-scale. For anomalous diffusion MSD(τ)=Γτα, where α is the anomalous diffusion coefficient. For MSD/τ, in log-log space, the slope is thus 0 for completely free diffusion that is when α = 1, and sub-diffusive(0<α<1), motions display higher negative slopes, with lower α corresponding to more anomalous motion.


