. 2018 Dec 27;7:e40497. doi: 10.7554/eLife.40497

Figure 5. Dynamic interphase hubs of Zld and Bcd.

Example images of the spatial distributions of Zld (A) and Bcd (B) at various time intervals illustrating the dynamic nature and wide range of size distributions and temporal persistences of enriched hubs (see also Figure 5—videos 24). mNeonGreen-Zld and EGFP-Bcd were imaged at 15 ms and 210 ms frame rates, respectively. To allow comparison, the sum projection of 14 frames (210 ms total integration) is shown for Zld. Images were processed with a 1-pixel radius median filter to remove salt-and-pepper noise and contrast-adjusted manually for visual presentation.

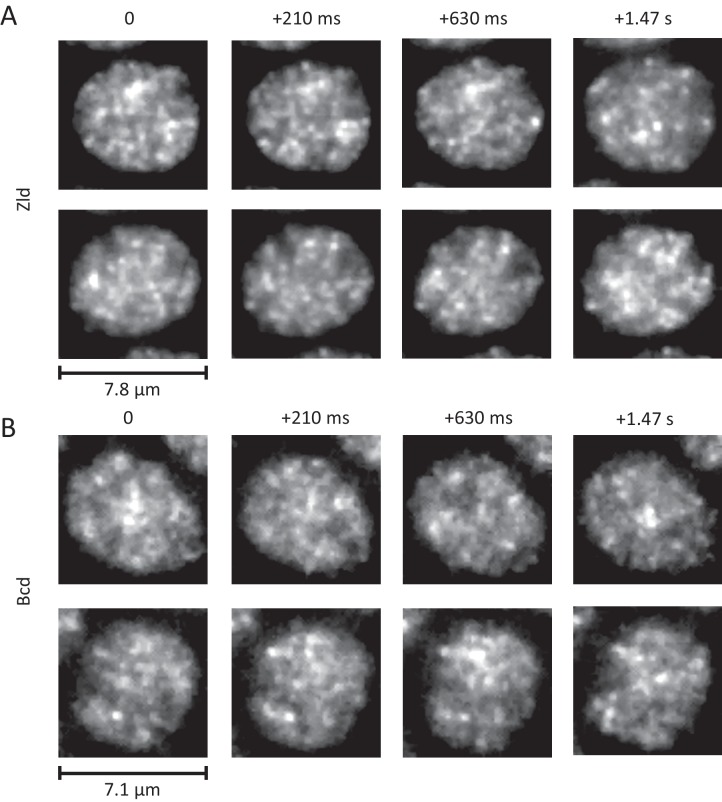
Figure 5.

Figure 5—video 1. Cell cycle dynamics of Zelda spatial distribution.
Download video file (590.1KB, mp4)
DOI: 10.7554/eLife.40497.023
Related to Figure 5. Maximum intensity projection over 81 slices spaced at 250 nm apart. Right is His2B-mCherry and left is sfGFP-Zld imaged through nuclear cycles 13 and 14. His2B is present at high concentrations in both the cytoplasm and nucleoplasm of Drosophila embryos, resulting in the extranuclear signal visible in the right panel. Time interval between each volume is 8.91 s. The field of view is 23.2 × 23.2 μm.
Figure 5—video 2. Four-dimensional Interphase dynamics of Zld spatial distributions.
Download video file (2.5MB, mp4)
DOI: 10.7554/eLife.40497.024
Related to Figure 5. Three-dimensional rendering of Zld spatial distribution in nuclear cycle 13. Progress bar indicates time in minutes. Slice spacing in z is 200 nm, time between volumes is 9.5 s.
Figure 5—video 3. Interphase dynamics of Zld spatial distributions at high temporal resolution.
Download video file (711.3KB, mp4)
DOI: 10.7554/eLife.40497.025
Related to Figure 5. Interphase dynamics of Zld spatial distribution at 10 ms exposure times and 15 ms frame rate.
Figure 5—video 4. Four dimensional dynamics of Bcd spatial distribution.
Download video file (5MB, mp4)
DOI: 10.7554/eLife.40497.026
Related to Figure 5. Three-dimensional rendering of Bcd spatial distribution from nuclear cycles 13–14. Progress bar indicates time in minutes. Slice spacing in z is 200 nm, time between volumes is 8 s.