. 2018 Nov 22;7:e35774. doi: 10.7554/eLife.35774

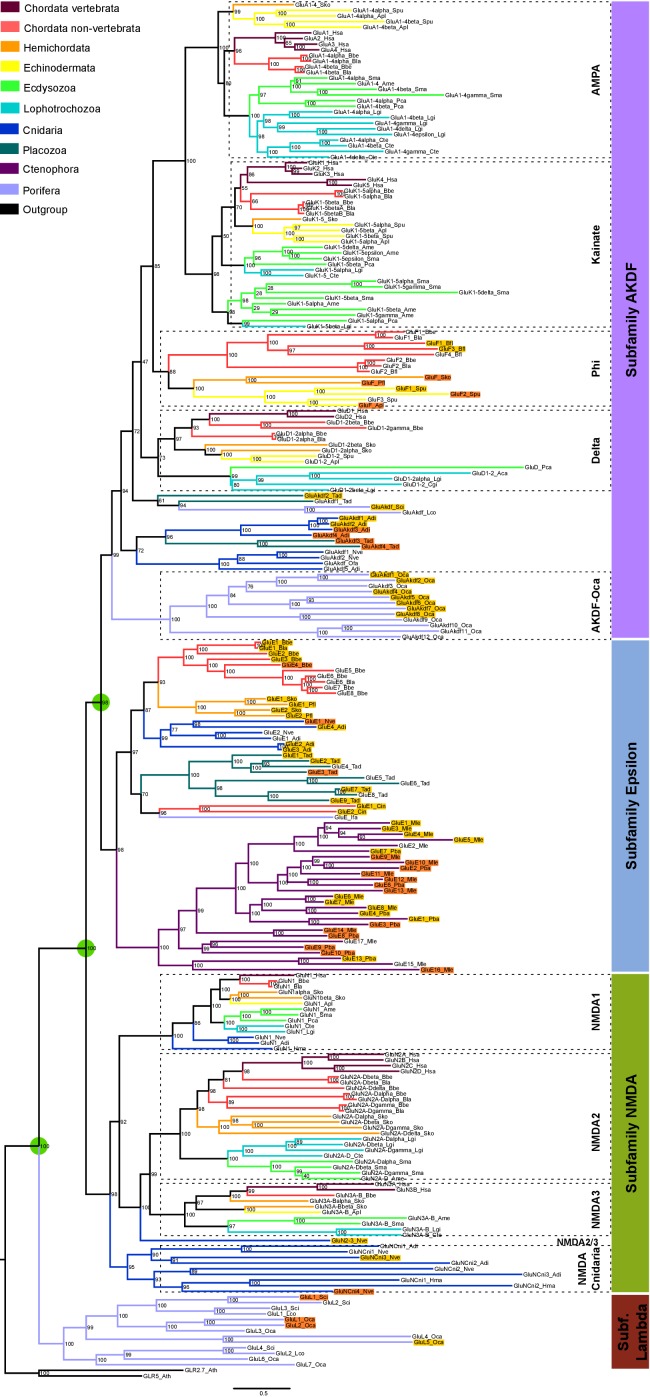
Figure 1. Bayesian phylogeny of metazoan ionotropic glutamate receptors.

Ionotropic glutamate receptor subfamilies are indicated in colored boxes at the right. Sequences belonging to the same class are highlighted together by dashed lines and the class name is also shown. Green circles highlight the three duplications occurred before the divergence of the ctenophore lineage that lead to these four subfamilies. Posterior probabilities are shown at tree nodes and protein names at the end of each branch. Tree branches are colored based on phylum, as indicated in the legend. For unreported phylogenetic groups, names of proteins predicted to bind glycine or glutamate are highlighted in yellow or orange, respectively. Protein names from non-vertebrate species are composed of four parts: (i) ‘GluR#’, where # is a code denoting class or subfamily (A, AMPA; K, Kainate; F, Phi; D, Delta; Akdf, AKDF; E, Epsilon; N, NMDA and L, Lambda); (ii) a number, or range of numbers, denoting orthologous vertebrate protein(s), if any; (iii) a Greek letter to identify non-vertebrate paralogs, if any and (iv) a three-letter species code. iGluRs from A. thaliana were used as an outgroup. All information on species and proteins used is given in Figure 1—source data 2. Phylogenetic reconstruction was performed using Bayesian inference. The amino acid substitution model used was Vt + G + F, number of generations: 14269000, final standard deviation: 0.007016 and potential scale reduction factor (PSRF): 1.000. Scale bar denotes number of amino acid substitutions per site. Although the GluAkdf2_Tad protein localizes to the Delta class in this tree, we do not consider this molecule as a confident member of this class. This is because the statistical support provided by the Bayesian analysis is low and because the Maximum-likelihood analysis (see Figure 1—figure supplement 1) does not position this protein in the Delta branch.

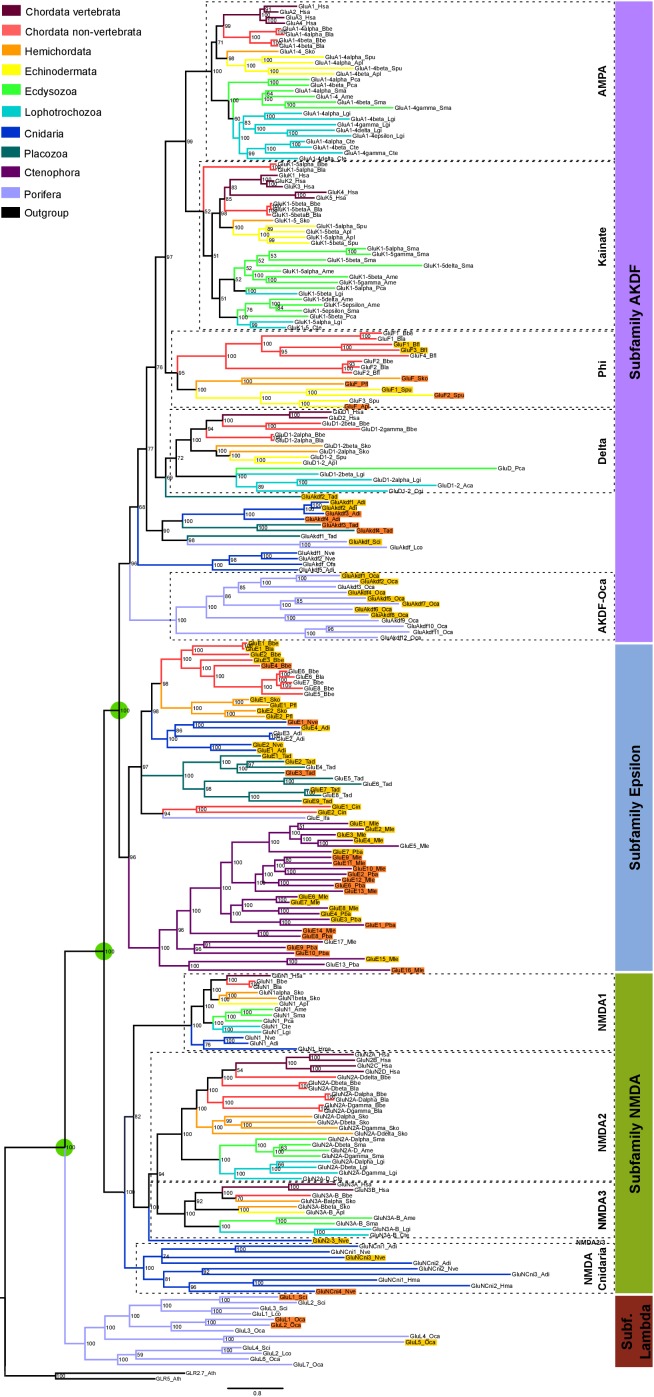
Figure 1—source data 1. Conservation of protein domains in ionotropic glutamate receptors from unreported groups.
DOI: 10.7554/eLife.35774.009
Figure 1—source data 2. Reference table of species and proteins used in the phylogenetic analysis of iGluRs.
DOI: 10.7554/eLife.35774.010
Figure 1—source data 3. Aligned protein sequences used to construct ionotropic glutamate receptor phylogenies.
DOI: 10.7554/eLife.35774.011
Figure 1—source data 4. Table with MolProbity scores of 3D models.
DOI: 10.7554/eLife.35774.012

Figure 1.

Figure 1—figure supplement 1. Maximum-likelihood phylogeny of metazoan ionotropic glutamate receptors.

Figure 1—figure supplement 1.

Ionotropic glutamate receptor subfamilies are indicated in colored boxes at the right. Sequences belonging to the same class are grouped together by dashed lines and the class name is also shown. Green circles highlight the three duplications occurred before the divergence of the ctenophore lineage that lead to these four subfamilies. Bootstrap values are shown at tree nodes and protein names at the end of each branch. Tree branches are colored based on phylum, as indicated in the legend. For unreported phylogenetic groups, names of proteins predicted to bind glycine or glutamate are highlighted in yellow or orange, respectively. Protein names from non-vertebrate species are composed of four parts: (i) ‘GluR#’, where # is a code denoting class or subfamily (A, AMPA; K, Kainate; F, Phi; D, Delta; Akdf; AKDF; E, Epsilon; N, NMDA and L, Lambda); (ii) a number, or range of numbers, denoting orthologous vertebrate protein(s), if any; (iii) a Greek letter to identify non-vertebrate paralogs, if any and (iv) a three-letter species code. iGluRs from A. thaliana were used as an outgroup. All information on species and proteins used in this phylogeny is given in Figure 1—source data 2. Phylogenetic reconstruction was performed using Maximum-likelihood inference. The amino acid substitution model used was Vt + G + F. Branch support was obtained after 1000 iterations of ultrafast bootstrapping (Hoang et al., 2018). Scale bar denotes number of amino acid substitutions per site.
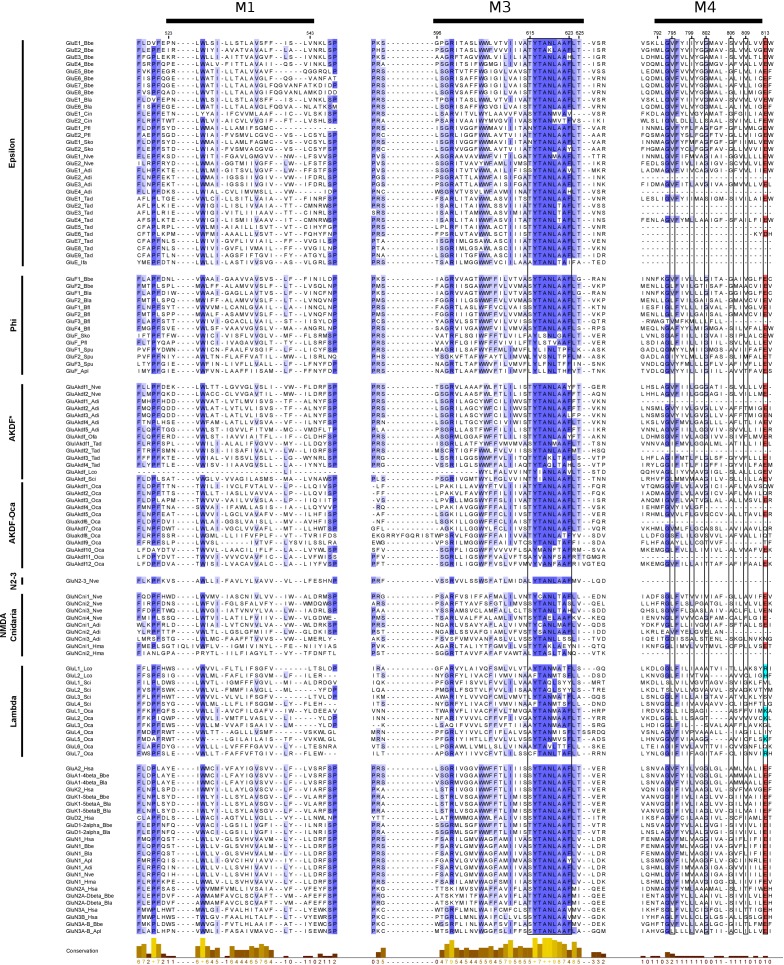
Figure 1—figure supplement 2. Multiple protein alignment of transmembrane regions M1, M3 and M4 from unreported iGluRs.

Figure 1—figure supplement 2.

The alignment includes protein sequences from members of unreported phylogenetic groups, with the exception of Epsilon sequences from ctenophores, which have been described previously (Alberstein et al., 2015). It also includes representative sequences of AMPA, Kainate, Delta and NMDA1-3 classes. Phylogenetic subfamily or class name is indicated in the left. Unclassified non-bilateral proteins from porifers, placozoans and cnidarians from the AKDF subfamily are labeled as AKDF*. iGluR residues are shadowed as follows: red for acid residues and light blue and basic ones. The highly conserved ‘SYTANLAAF’ motif (at M3) and the M4 residues involved in tetramerization are highlighted by a black frame. Higher amino acid conservation is represented by increasing intensity of blue background and by a bar chart at the bottom. Residue numbers shown on top indicate the start and finish of each transmembrane helix. Protein numbering corresponds to mature rat GluA2 sequence. Figure was prepared with Jalview v2.10.4b1 (Waterhouse et al., 2009).
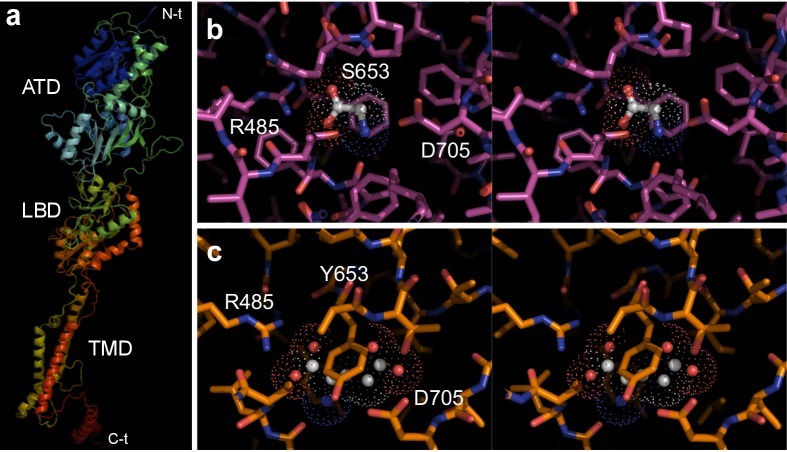
Figure 1—figure supplement 3. Three-dimensional models of Epsilon class members.

Figure 1—figure supplement 3.

(a) Three-dimensional model of the full-length GluE1 from B. lanceolatum. Secondary structure elements are shown with rainbow color-coding from N- to C-terminus (β-strands, arrows; α-helices, coils). The major amino-terminal, ligand-binding and transmembrane domains (ATD, LBD and TMD, respectively) are indicated. (b, c) Stereo plots of ligand-binding pockets (LBP) in Epsilon family members from amphioxus. Close-ups of the ligand binding site in (b) GluE1 from B. lanceolatum and (c) GluE7 from B. belcheri. Residues are shown as sticks, color-coded (carbon, magenta or orange, respectively; oxygen, red; and nitrogen, blue). (b) Bound glycine is color coded with carbon atoms in white; its Van-der-Waals shell is represented by a dotted surface. Hydrogen bonds between bound glycine and Arg485 are indicated as white dotted lines. For simplicity, only a few residues have been labeled. Note that glycine is perfectly accommodated inside the GluE1 LBP. This is restricted by the side chains of Pro655 and Trp704 (these side chains would collide with a bound glutamate, explaining the preference for the less bulky glycine), but also by that of a serine at position 653. (c) A putatively bound glutamic acid has been modeled in the LBP of GluE7. This is shown by a dotted surface representing its Van-der-Waals shell and solid spheres for its carbon, nitrogen and oxygen atoms. Note that GluE7 presents a bulky tyrosine at position 653 instead of the serine found in GluE1. The side chain from Tyr653 would essentially occupy the ligand-binding pocket of GluE7, leaving no space for any ligand. These structural features are fully in line with the results of electrophysiological experiments.
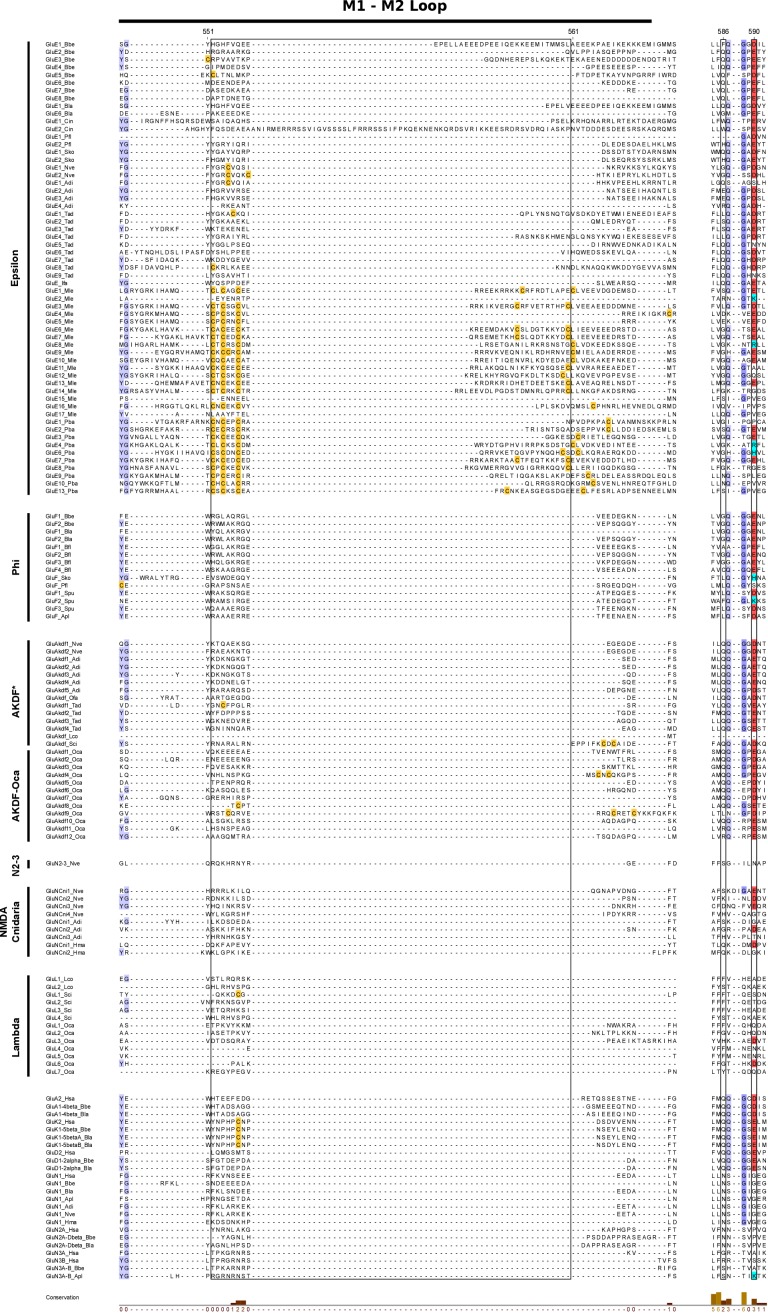
Figure 1—figure supplement 4. Multiple protein alignment of the M1-M2 intracellular loop and the Q/R and +4 sites.

Figure 1—figure supplement 4.

The alignment includes all protein sequences from unreported phylogenetic groups and representative sequences of AMPA, Kainate, Delta and NMDA receptor subunits. Unclassified non-bilateral proteins from porifers, placozoans and cnidarians from the AKDF subfamily are labeled as AKDF*. iGluR residues are shadowed as follows: yellow for cysteines and red and light blue for acid and basic residues, respectively. The characteristic insertion in the M1-M2 intracellular loop presented by Epsilon subunits is highlighted by a black frame. The Q/R (Q586) and the Q/R +4 sites, involved in calcium permeability and polyamines block of some AMPA and Kainate receptors, are indicated by a black frame. Protein numbering corresponds to mature rat GluA2 sequence. Higher amino acid conservation is represented by increasing intensity of blue background and by a bar chart at the bottom. Figure was prepared with Jalview v2.10.4b1 (Waterhouse et al., 2009).
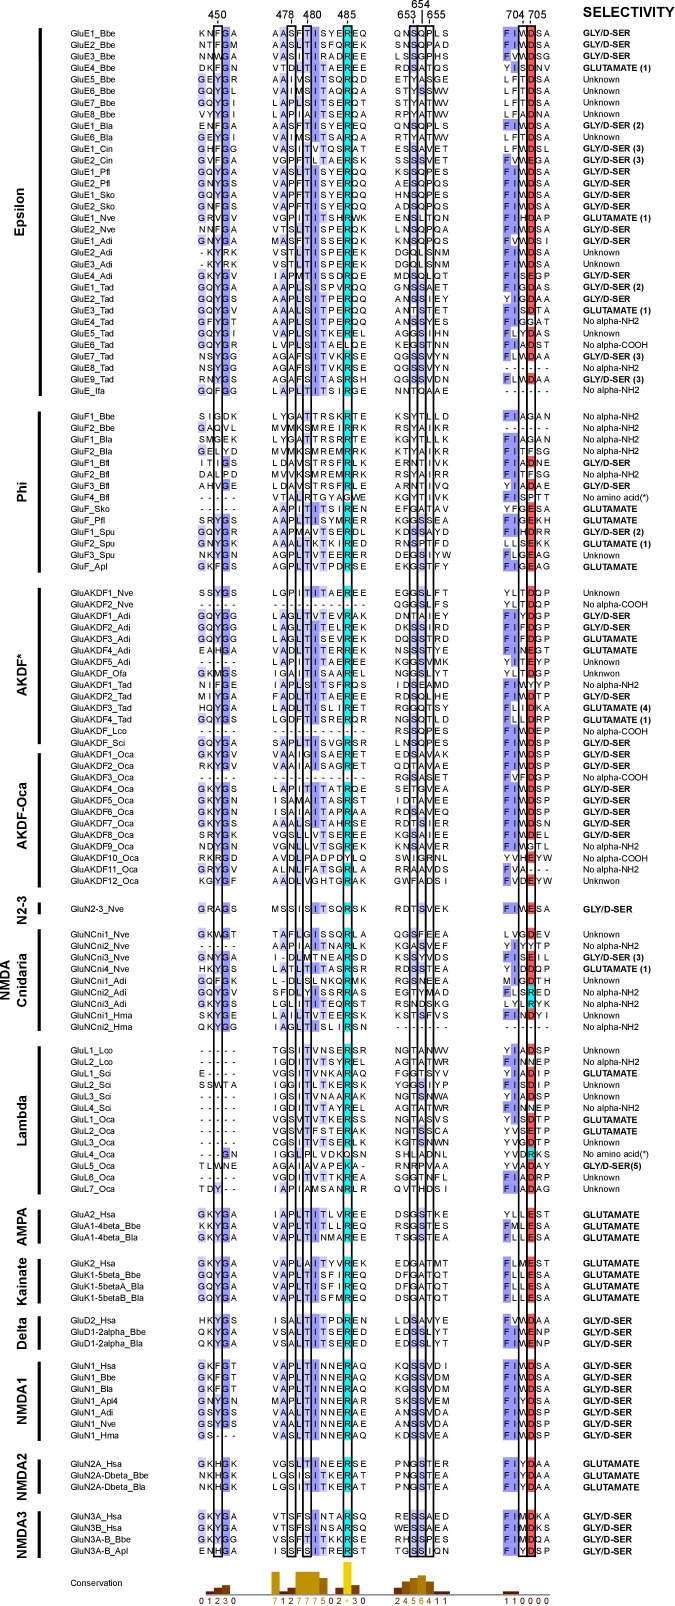
Figure 1—figure supplement 5. Multiple protein alignment of iGluR residues involved in ligand-binding.

Figure 1—figure supplement 5.

Protein sequences shown belong to unreported phylogenetic groups (with the exception of Epsilons from ctenophores, which have been described previously [Alberstein et al., 2015]). Representative sequences for AMPA, Kainate, Delta and NMDA classes are also shown. Unclassified non-bilateral proteins from porifers, placozoans and cnidarians from the AKDF subfamily are labeled as AKDF*. Residue numbering is shown on top and corresponds to mature rat GluA2 sequence. Residues involved in agonist binding are highlighted by a black frame. Of these, residue 450 is involved in Van-der-Waals interactions with the α-carbon, residues 485 and 654 engage in electrostatic interactions with the α-carboxyl group, residues 478, 480 and 705 form interactions with the α-amino group and residues 653, 655 and 704 contact the amino acid side chain. iGluR residues are shadowed as follows: red for acid residues and light blue for basic ones. Higher amino acid conservation is represented by increasing intensity of blue background and by a bar chart at the bottom. Agonist selectivity is indicated at the right. Overall prediction is based on sequence similarity with vertebrate proteins, but in particular considers the following sequences: (Fonnum, 1984) similarity with the M. leidyi GluE13_Mle sequence (gene reference ML05909A), (Danbolt, 2001) similarity with H. sapiens GluN3A sequence, (Pascual-Anaya and D'Aniello, 2006) similarity with H. sapiens GluN1 sequence (Sobolevsky et al., 2009) similarity with AMPA receptor subunits sequence and (Conn and Pin, 1997) similarity with M. leidyi GluE7_Mle (gene reference ML032222a). Protein sequences with changes predicted to abolish binding to the α-amino (No α-NH2) or α-carboxyl (No α-COOH) group are also indicated. For some sequences a reliable prediction cannot be made, these are labeled as ‘Unknown’. Figure was prepared with Jalview v2.10.4b1 (Waterhouse et al., 2009).