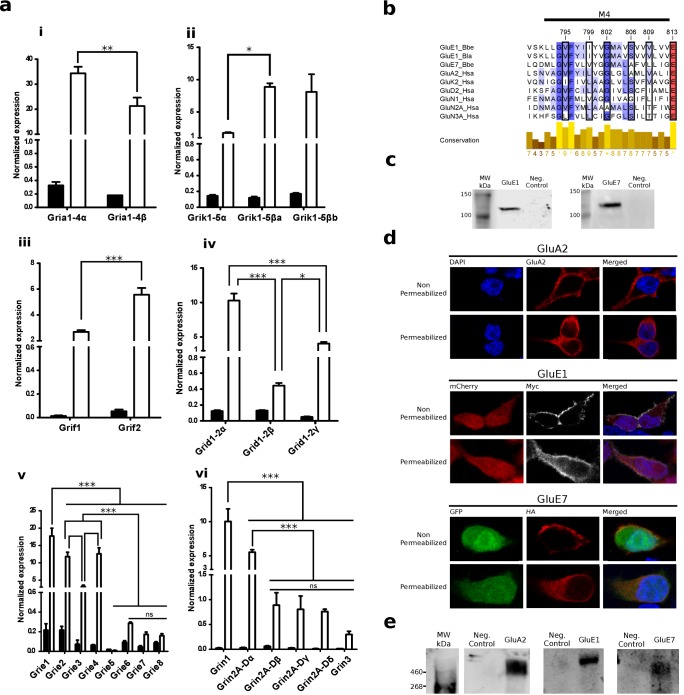
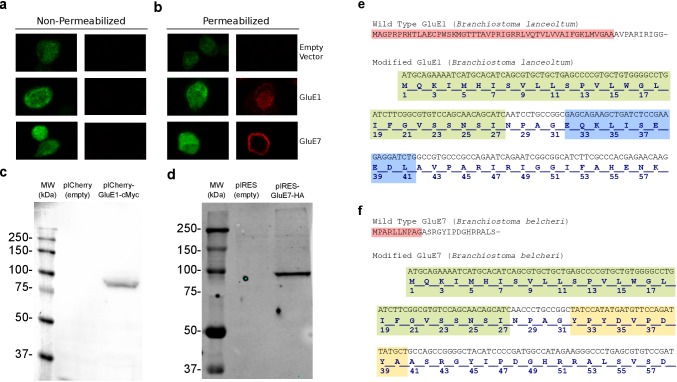
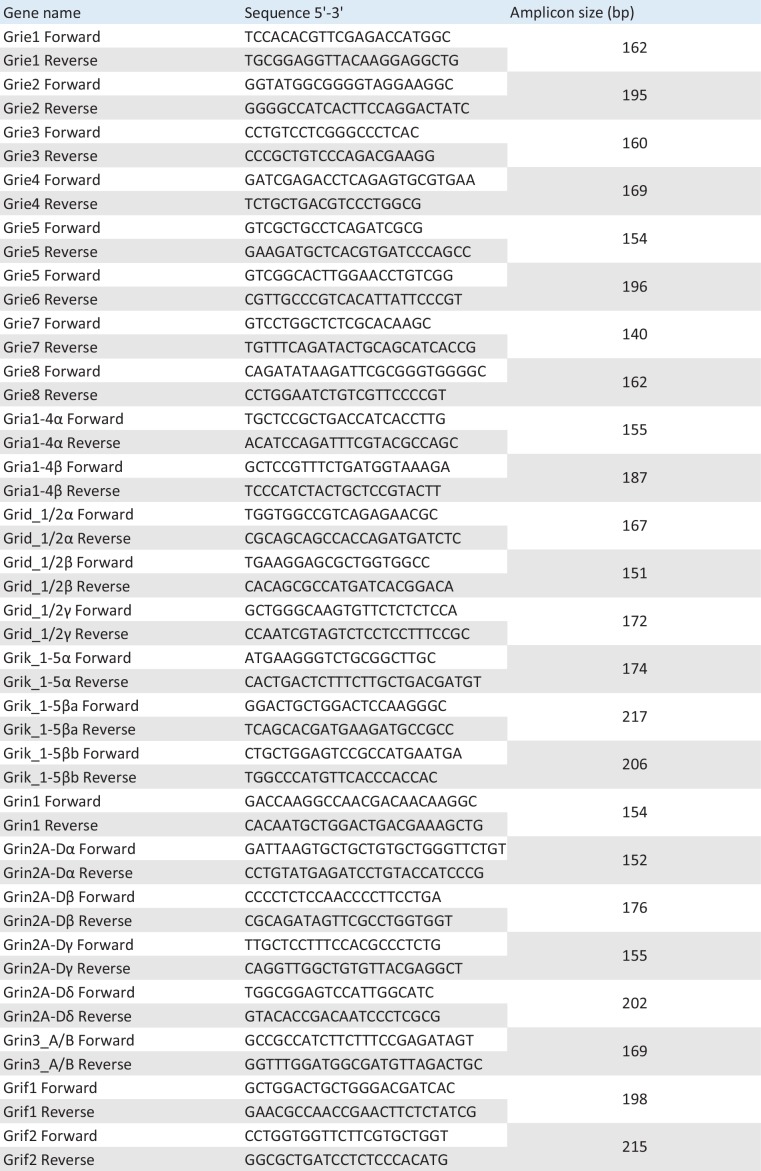
Figure 4. Expression and functional analysis of amphioxus iGluRs.
(a) iGluRs mRNA expression (mean and standard deviation) in Branchiostoma lanceolatum. Bars show average relative expression of B. lanceolatum (amphioxus) iGluR genes as determined by qPCR. Filled bars represent whole body and open bars nerve cord expression levels. Note that all genes show significantly enriched expression in the nerve chord relative to the whole body, with the exception of Grie5 (Student’s t-test, n = 3). Expression level in the nerve chord is compared across genes of the same class. Statistics: pair comparisons were done by Student’s t-test, n = 3, multiple comparisons were done by one-way ANOVA followed by Tukey’s Post-Hoc test, n = 3. Significance levels: ***p < 0.001, **p < 0.01 and *p < 0.05; ns, not significant. (i) AMPA class. (ii) Kainate class. (iii) Phi class. (iv) Delta class. (v) Epsilon subfamily. (vi) NMDA classes. (b) Multiple sequence alignment of iGluRs transmembrane region M4 containing residues involved in tetramerization, these are indicated by a black frame. Higher amino acid conservation is represented by increasing intensity of blue background and by a bar chart at the bottom. Sequences included are GluE1 and GluE7 from amphioxus and representatives of human iGluRs. (c) Immunoblot of chimeric GluE1 and GluE7, containing the signal peptide from rat GluA2, expressed in HEK293T cells. Proteins were detected using the immuno-tags (c-Myc and HA, respectively) located after the rat signal peptide. Protein extracts from non-transfected cells were loaded as negative controls. (d) Immunofluorescence of HEK293T cells expressing rat GluA2 (top), cMyc-tagged GluE1 (middle) or HA-tagged GluE7 (bottom). Both non-permeabilized and permeabilized conditions are shown. (e) Immunoblot of tetrameric rat GluA2, GluE1 and GluE7 expressed in HEK293T cells. Amphioxus proteins were detected using the immuno-tags (c-Myc and HA, respectively) located at the N-terminus of each sequence. Protein extracts from non-transfected cells were loaded as negative controls.


