. 2018 Nov 22;7:e35774. doi: 10.7554/eLife.35774

Figure 6. Bayesian phylogeny of metazoan metabotropic glutamate receptors.

Identified metabotropic glutamate receptor classes from bilateral and non-bilateral organisms are indicated by colored boxes at the right. Dashed boxes further highlight individual classes from bilateral organism. Posterior probabilities are shown at tree nodes and protein names at the end of each branch. Tree branches are colored based on phylum, as indicated in the legend. Protein names from non-vertebrate species are composed of four parts: (i) ‘mGluR’, followed by a number, or range of numbers, denoting orthologous vertebrate protein(s), if any (for Class IV and group I-II-III-IV proteins, the name is followed by the name of the class/group); (ii) a Greek letter to identify non-vertebrate paralogs, if any and (iv) a three-letter species code. GABA-B receptors from vertebrates were used as an outgroup. All information on species and proteins used in this phylogeny is given in Figure 6—source data 2. Phylogenetic reconstruction was performed using Bayesian inference. The amino acid substitution model used was WAG + I + G + F, number of generations: 5327000, final standard deviation: 0.004788 and potential scale reduction factor (PSRF): 1.001. Scale bar denotes number of amino acid substitutions per site.

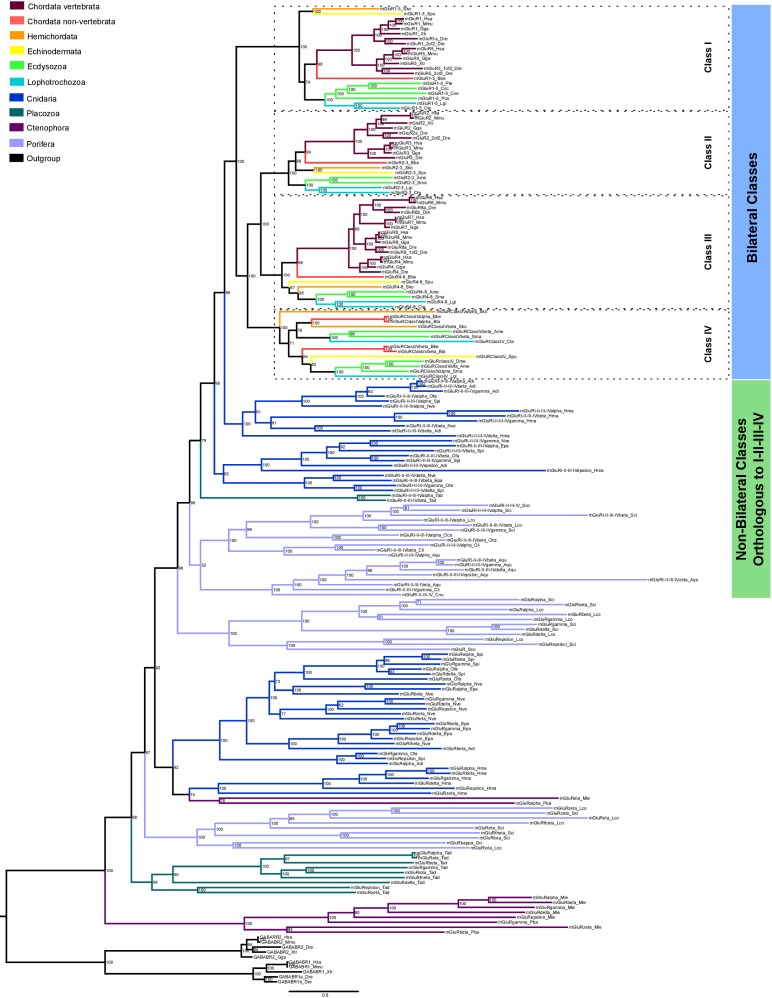
Figure 6—source data 1. Conservation of protein domains in metabotropic glutamate receptors from unreported classes.
DOI: 10.7554/eLife.35774.028
Figure 6—source data 2. Reference table of species and proteins used in the phylogenetic analysis of mGluRs.
DOI: 10.7554/eLife.35774.029
Figure 6—source data 3. Aligned protein sequences used to construct metabotropic glutamate receptor phylogenies.
DOI: 10.7554/eLife.35774.030
Figure 6—source data 4. qPCR values used to generate Figure 6—figure supplement 2b.
DOI: 10.7554/eLife.35774.031

Figure 6.

Figure 6—figure supplement 1. Maximum-likelihood phylogeny of metazoan metabotropic glutamate receptors.

Figure 6—figure supplement 1.

Identified metabotropic glutamate receptor classes from bilateral and non-bilateral organisms are indicated by colored boxes at the right. Dashed boxes further highlight individual classes from bilateral organism. Bootstrap values are shown at tree nodes and protein names at the end of each branch. Tree branches are colored based on phylum, as indicated in the legend. Protein names from non-vertebrate species are composed of four parts: (i) ‘mGluR’, followed by a number, or range of numbers, denoting orthologous vertebrate protein(s), if any (for Class IV and group I-II-III-IV proteins, the name is followed by the name of the class/group); (ii) a Greek letter to identify non-vertebrate paralogs, if any and (iv) a three-letter species code. GABA-B receptors from vertebrates were used as outgroup. All information about species and proteins used in this phylogeny is given in Figure 6—source data 2. Phylogenetic reconstruction was performed using Maximum-likelihood inference. The amino acid substitution model used was: WAG + I + G + F. Branch support was obtained after 1000 iterations of ultrafast bootstrapping (Hoang et al., 2018). Scale bar denotes number of amino acid substitutions per site.
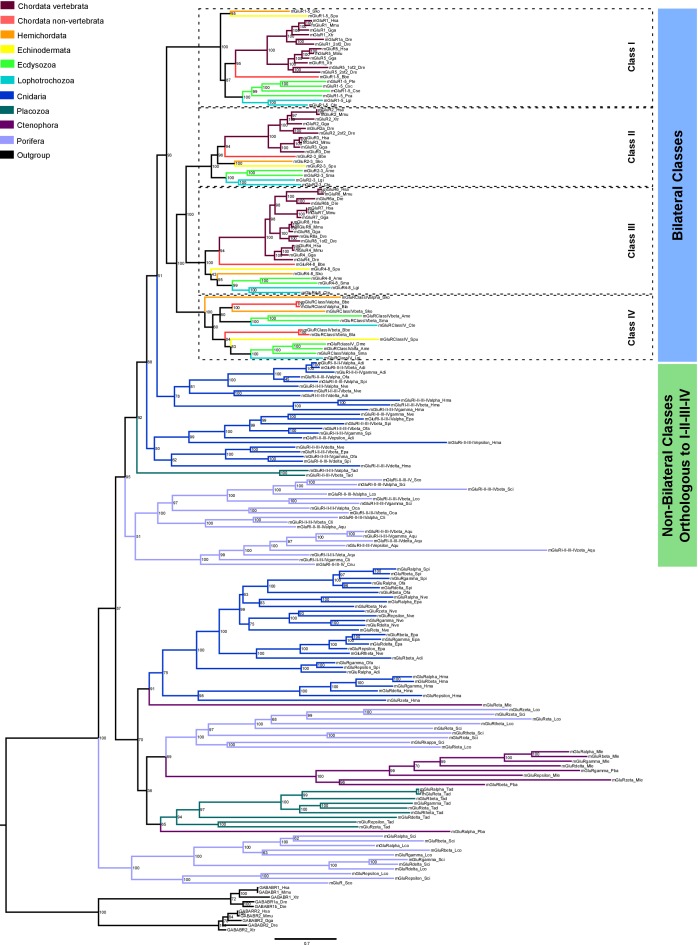
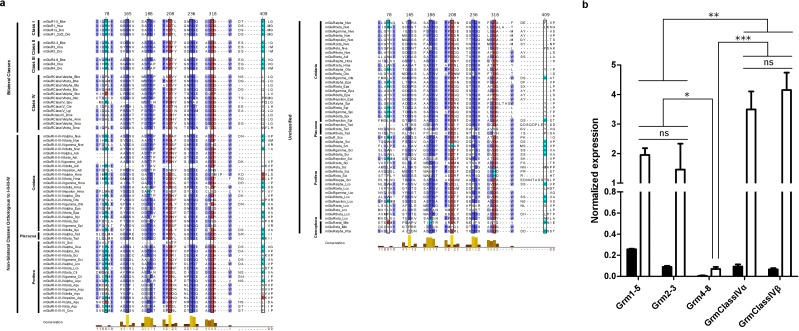
Figure 6—figure supplement 2. Multiple protein alignment of mGluR residues involved in ligand binding and expression levels of B.lanceolatum mGluR genes.

Figure 6—figure supplement 2.

(a) Multiple alignment of mGluR residues involved in ligand binding. Representative class I-III chordate proteins and all class IV sequences identified are included (with the only exception of mGluRClassIVβ_Ame as it is incomplete). Also, representative sequences from non-bilaterian groups of mGluRs are shown. Bilateral classes, non-bilateral classes orthologous to I-II-III-IV and unclassified proteins are labeled in the left. Class name is also indicated. Residue numbers are indicated on top and correspond to human mGluR1. Residues involved in agonist binding are highlighted by a black frame, these are: residues 165 and 168 that perform electrostatic interactions with the α-carboxyl group, residues 208, 236 and 318 that bind the α-amino group and residues 78 and 409 that contact the amino acid side chain. Acid residues are colored in red and basic residues in light blue. Higher amino acid conservation is represented by increasing intensity of blue background and by a bar chart at the bottom. Figure was prepared with Jalview v2.10.4b1 (Waterhouse et al., 2009). (b) Bars show average (and standard deviation) relative expression of Branchiostoma lanceolatum (amphioxus) mGluR genes as determined by qPCR. Filled bars represent whole body and open bars nerve cord expression levels. All genes show significantly enriched expression in the nerve chord relative to the whole body (Student’s t-test, n = 3). Expression level in the nerve chord is compared across all genes. Note that class IV genes show the highest expression. Statistics: one-way ANOVA followed by Tukey’s Post-Hoc test, n = 3. Significance levels: ***p < 0.001, **p < 0.01 and *p < 0.05; ns, not significant.
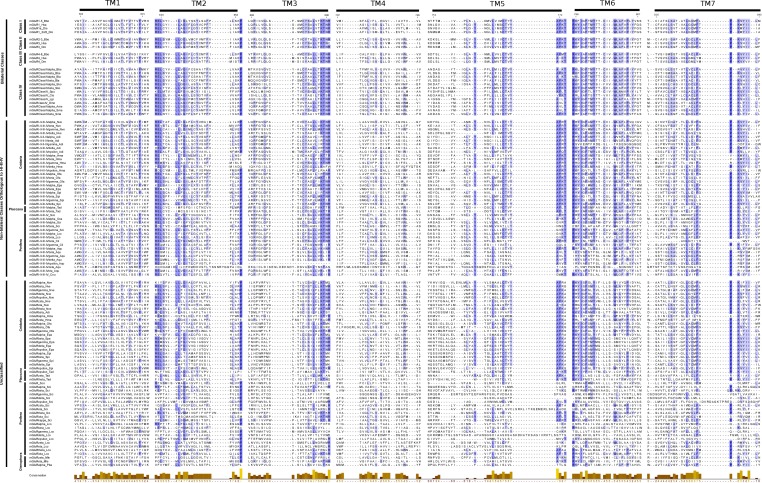
Figure 6—figure supplement 3. Multiple protein alignment of mGluR transmembrane regions.

Figure 6—figure supplement 3.

The alignment includes all protein sequences from class IV together with vertebrate and amphioxus representative sequences of class I-III. Representative sequences from non-bilaterian groups are also shown. Bilateral classes, non-bilateral classes orthologous to I-II-III-IV and unclassified proteins are labeled in the left. Class name is also indicated. Residue numbers are shown on top and correspond to human mGluR1. Higher amino acid conservation is represented by increasing intensity of blue background and by a bar chart at the bottom. Figure was prepared with Jalview v2.10.4b1 (Waterhouse et al., 2009).
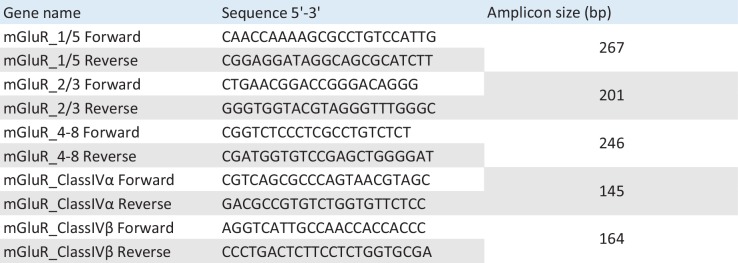
Figure 6—figure supplement 4. List of primers used in qPCR experiments.

Figure 6—figure supplement 4.

Primer sequences are included.