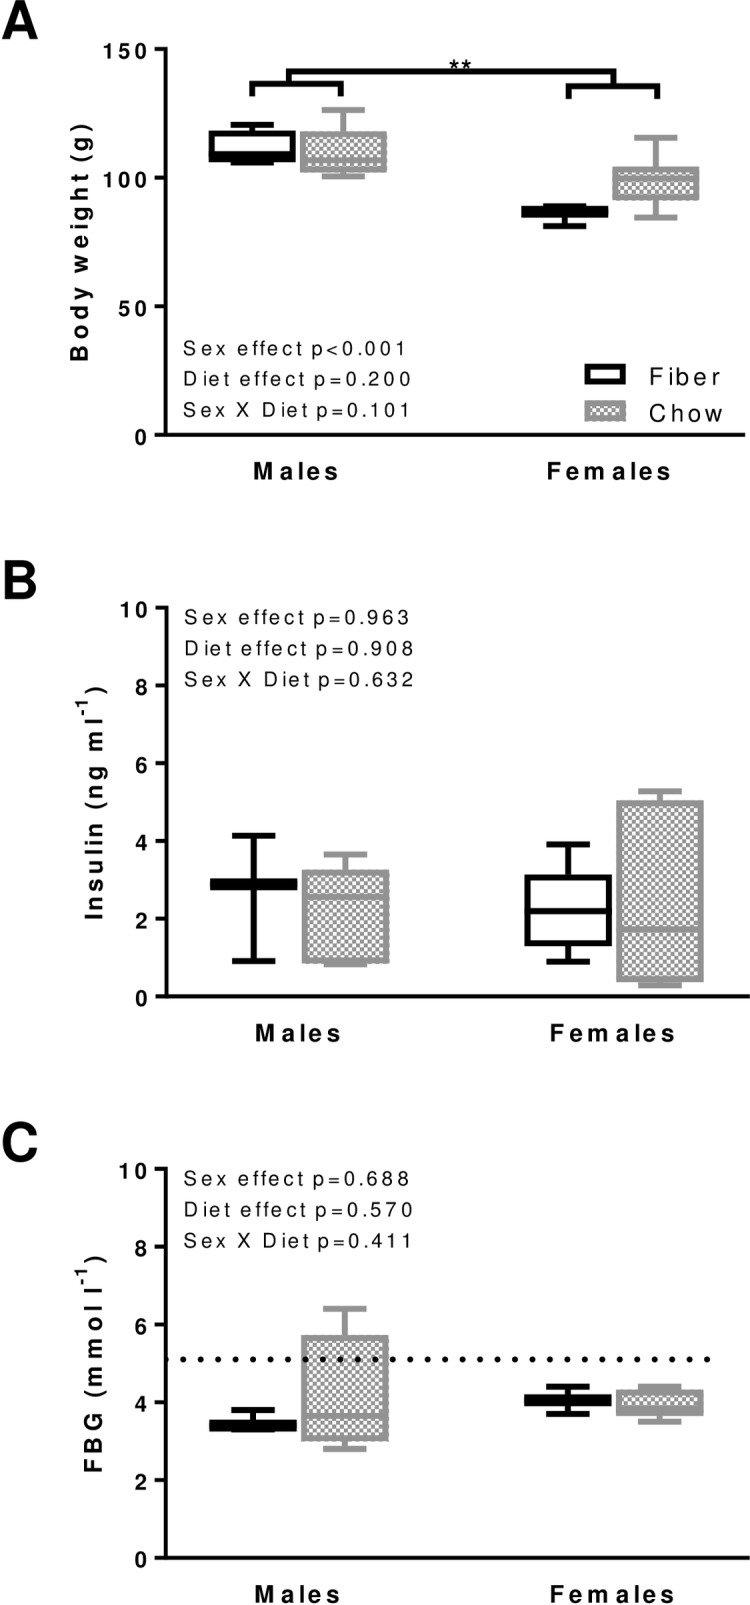
Fig 1. Metabolic phenotype in the males and females from the Fiber (black boxes) and Chow (grey boxes) groups.

Body weight (A), fasting blood insulin (B) and glucose (FBG, C) were measured. Boxes indicate the minimum, 25th percentile, median, 75th percentile, and maximum. Significant differences between dietary groups or sexes are indicated with ** for p<0.01. In males, N equals 4 and 5 for body weight and 3 and 4 for insulin and FBG in the Fiber and Chow group, respectively. In females, N equals 3 and 6 for body weight, insulin and FBG in the Fiber and Chow group, respectively. Kruskal-Wallis results are indicated on each panel; data are from the same animals for which echocardiography was performed, with the exception of Fiber females for the insulin data only, and Chow females which represent a distinct group of age-matched animals.
