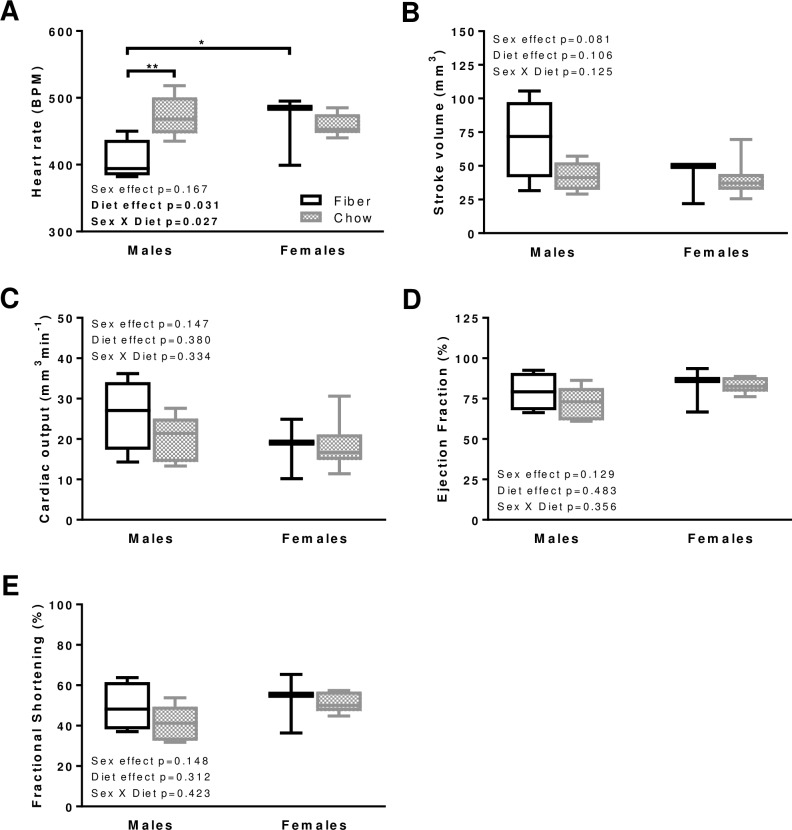
Fig 3. Systolic function in males and females from the Fiber (black boxes) and Chow (grey boxes) groups.
The following indicators were measured: heart rate (A), stroke volume (B), cardiac output (C), ejection fraction (D), fractional shortening (E). Boxes indicate the minimum, 25th percentile, median, 75th percentile, and maximum. In males, N equals 4 and 5 in the Fiber and Chow group, respectively. In females N equals 3 and 8 in the Fiber and Chow group, respectively. Significant differences between dietary groups or sexes are indicated with ** for p<0.01 and * for p<0.05. Kruskal-Wallis results are indicated on each panel.

