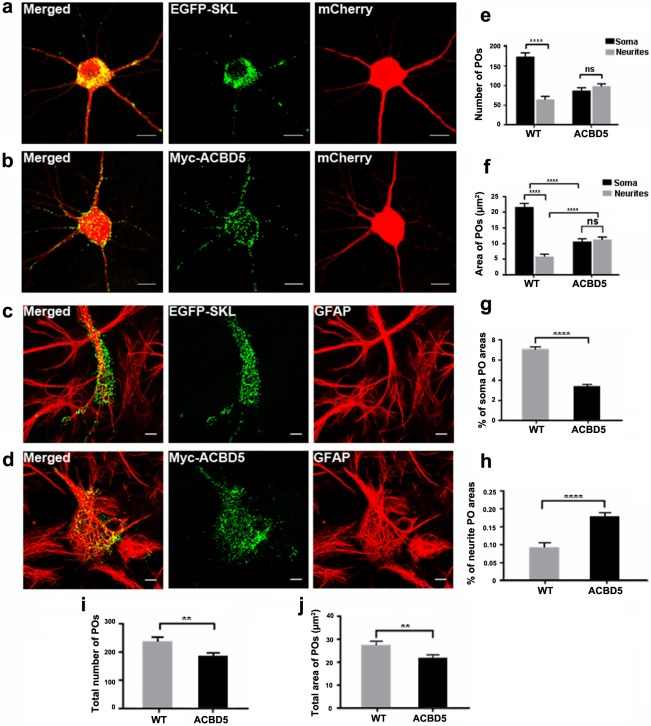
Fig 3. PO morphology and distribution in primary hippocampal neurons in response to the overexpression of myc-ACBD5.
(a, b) POs in neurons co-transfected with plasmids encoding cytosolic mCherry as well as (a) EGFP-SKL and (b) myc-ACBD5 respectively. (c, d) PO distribution in astrocytes of the primary hippocampal cultures with (d) or without (c) myc-ACBD5 expression. Astrocytes were identified by GFAP immunostaining. Note that POs in astrocytes unlike in neurons are similarly distributed in both conditions. (e) PO numbers and (f) area distribution (μm2) in the soma and neurites (proximal 30 μm). (g, h) Percentage areas of POs in soma (g) and neurites (h) (proximal 30 μm). (i) Total PO number and (j) area covered by POs in transfected neurons. Representative immunofluorescence images are presented as maximum intensity projections (scale bar: 10 μm).

