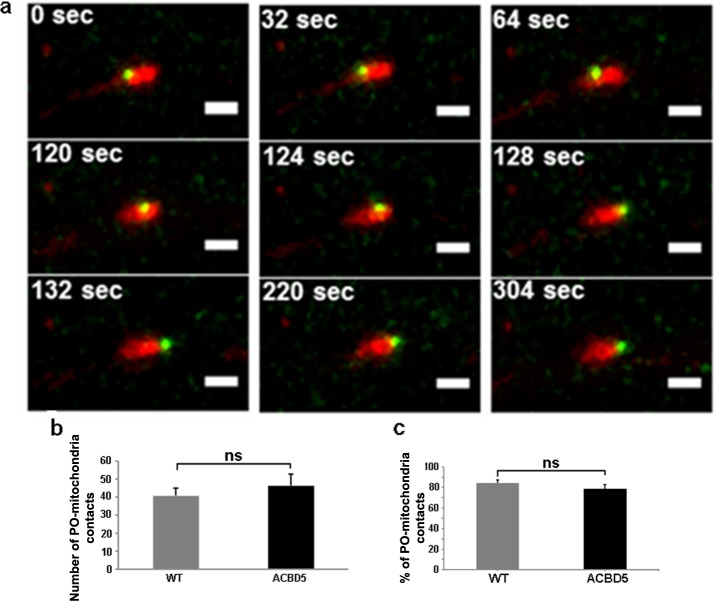
Fig 5. Close contacts of POs and mitochondria in live confocal images.
(a) Time lapse series of a PO “surfing” on a mitochondrion over a period of 5 min (scale bar: 2 μm, maximum intensity projections). (b, c) Absolute numbers and proportion of POs juxtaposed to mitochondria in the neurite area of each hippocampal neuron.

