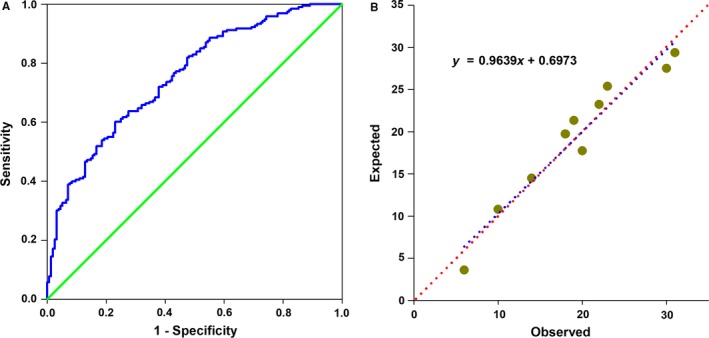
Figure 3.

The discrimination and calibration of the predictive model of Metrnl for CAD. (A) Receiver operating characteristic (ROC) curve for the predicted probabilities without (red dot line) and with the marker Metrnl (blue dot line). (B) Scatter plot of predicted probabilities without and with the marker Metrnl
