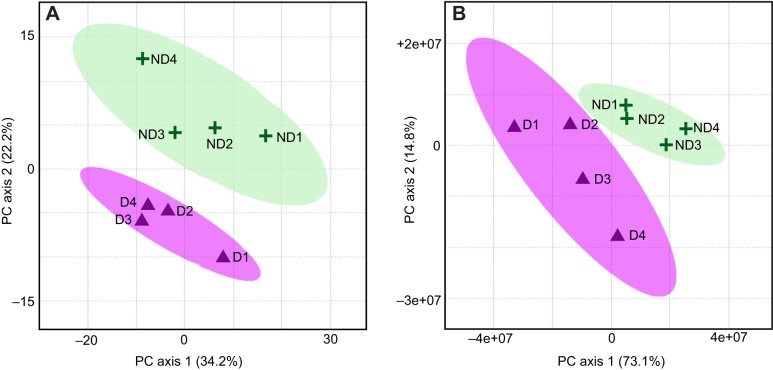
Fig. 1.
Overall metabolomic and lipidomic profiles differ for diapause and non-diapause samples. Principal component analysis (PCA) plot of (A) lipidomic and (B) untargeted metabolomic datasets. Purple triangles represent biological replicates of diapause (D) eggs. Green crosses represent biological replicates of non-diapause (ND) eggs. Purple and green shaded regions surrounding the points represent the 95% confidence interval for diapause and non-diapause conditions, respectively. The percentage variance explained by each of the first two principal components is listed parenthetically.

