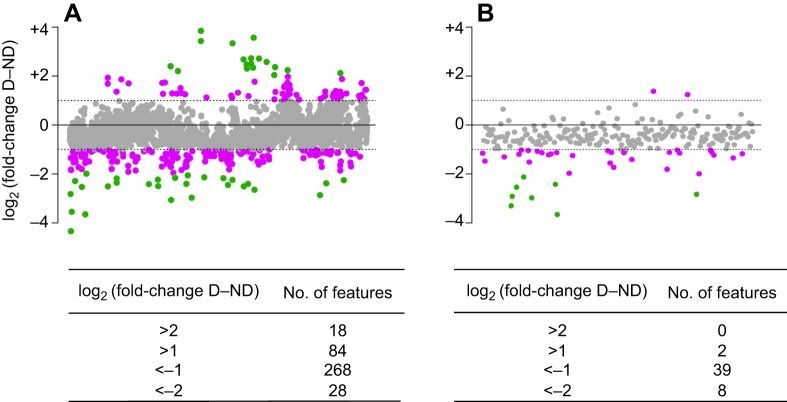
Fig. 3.
Metabolites tend to exhibit lower abundance in diapause eggs. Data are log2 fold-change in relative abundance of untargeted metabolites in biological replicates of diapause eggs (n=4) relative to non-diapause eggs (n=4) for (A) all features with relative standard deviation (RSD)<30% and (B) only annotated metabolites. Dashed lines indicate a log2 fold-change of |1|. Purple dots indicate metabolites with >|1| log2 fold-change and green dots represent metabolites with >|2| log2 fold-change; counts of the number of features at each fold-change cutoff are provided in the tables below each figure. A complete list of log2 fold-change values for all metabolites in these figures is provided in Table S4.

