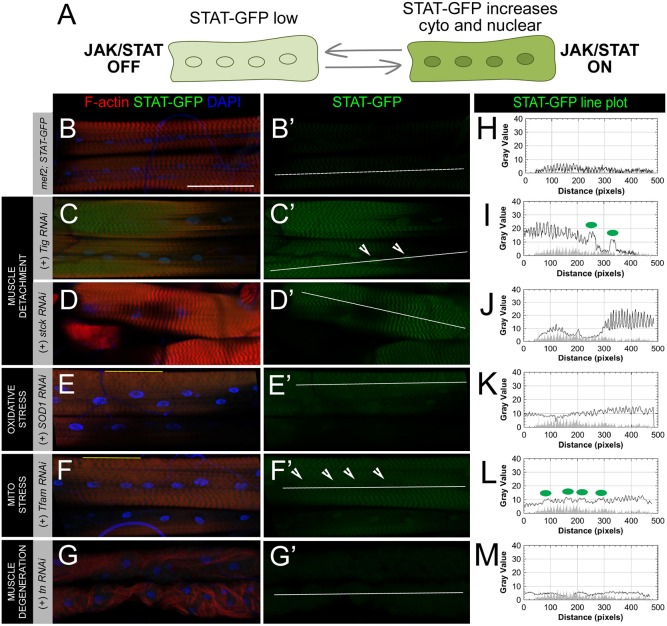
Fig. 1.
JAK-STAT is activated by specific classes of muscle stress. (A) Schematic of the JAK-STAT reporter, 10xSTAT92E-GFP (STAT-GFP), which contains STAT binding sites enabling GFP transcription upon STAT activity in the nucleus. Activation of JAK-STAT signaling causes increased expression of the STAT-GFP reporter in both the cytoplasm and nucleus. (B–G) Muscle phenotypes (F-actin, red) and nuclear positioning (DAPI, blue) in select RNAi knockdowns via muscle-specific GAL4/UAS inducing different classes of cellular stress. (B′–G′) STAT expression in L3 larval muscles as measured with the STAT-GFP reporter (GFP, green). (B,B′) STAT levels are low or nearly undetectable in the cytoplasm and nucleus of unstressed larval muscles. (C,C′) RNAi knockdown of Tig in muscles leads to weakened tendon cell anchoring, but muscle attachments are maintained across hemisegments. Partial detachment is associated with cytoplasmic and nuclear increases in STAT expression (arrowheads). (D,D′) RNAi knockdown of stck, which encodes the integrin-associated PINCH protein, enhances STAT-GFP expression in muscles. Although knockdown of stck can cause muscle detachment, an attached muscle was selected for analysis to simplify interpretation. (E,E′) Perturbations to oxidative stress induced through knockdown of Sod1 causes subtle disruptions to the sarcomeric spacing of muscles (see regions marked by yellow line in E) and STAT-GFP levels to weakly increase. (F,F′) Mitochondrial stress caused through knockdown of the mitochondrial protein, TFAM, causes similar disruptions to muscle sarcomeres (yellow line in F) and activates JAK-STAT signaling. (G,G′) Myofibrillar unbundling and muscle degeneration resulting from tn knockdown is not capable of activating JAK-STAT signaling. (H–M) Line plot analysis of STAT-GFP fluorescence intensity throughout the cytoplasm and nucleus (white lines) in panels B′–G′. Green dots on each graph correspond to arrowheads marking nuclei in each image panel. GFP intensity from STAT-GFP control muscle in panel H is overlaid on line plots as a gray-filled profile in panels I–M. Additional examples of stresses can be found in Fig. S1. Scale bars: 100 µm.

