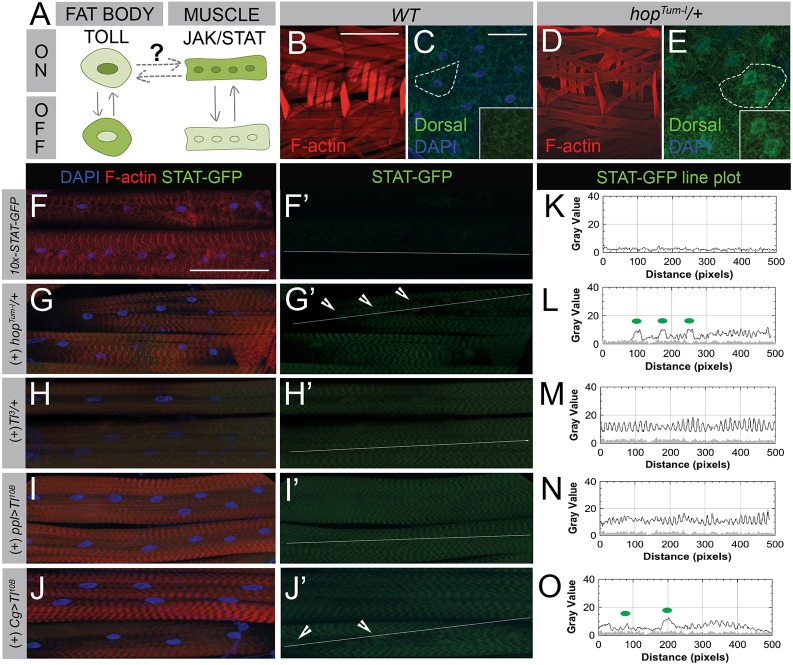
Fig. 6.
JAK-STAT and Toll pathways are activated in a reciprocal signaling network. (A) Schematic showing experimental design used to determine the relationship between Toll and JAK-STAT signaling. When Toll signaling is activated in the fat body, Dl staining concentrates in the nucleus. Activation of JAK-STAT results in increased STAT-GFP expression in both the cytoplasm and nucleus of muscles. (B–E) Impact of JAK-STAT signaling in L3 muscle on systemic Toll signaling. (B) Two hemisegments of wild-type muscle (F-actin, red) with stable attachment sites. (C) The NFκB transcription factor, Dl (Dorsal, green), localizes to the cytoplasm of fat body cells (outline, inset). Nuclei are stained with DAPI (blue). (D) Constitutively active hopTum-l mutants have muscles with no visible defects. (E) Dl translocates into the nucleus of fat body cells following JAK-STAT activation via the hopTum-l mutation (outline, inset). For tissue-specific expression of hopTum-l see Fig. S6. (F–J′) Analysis of JAK-STAT signaling following Toll activation. (F,F′) In wild-type muscles, expression levels of the STAT reporter STAT-GFP (green) are low. (G,G′) Overall activation of the Drosophila JAK allele, hopTum-l, causes STAT-GFP levels to increase in both the cytoplasm and nuclei (arrowheads) of muscle tissue. (H–J′) Constitutively active Toll signaling using the activated Toll allele Tl3 (H,H′) or UAS-Tl10B expressed using a fat body- and salivary gland-specific driver (I,I′) or fat body- and hemocyte-specific driver (J,J′) increases STAT levels in larval muscle. (K–O) Line plot analysis of STAT-GFP fluorescence intensities measured from white lines drawn in panels F′–J′. Green dots on each graph correspond to arrowheads marking nuclei in each image panel. GFP intensity from STAT-GFP control muscle in panel K is overlaid on line plots as a gray-filled profile in panels L–O. Scale bars: 500 µm in B,D; 50 µm in C,E; 100 µm in F–J′.

