Fig. 6.
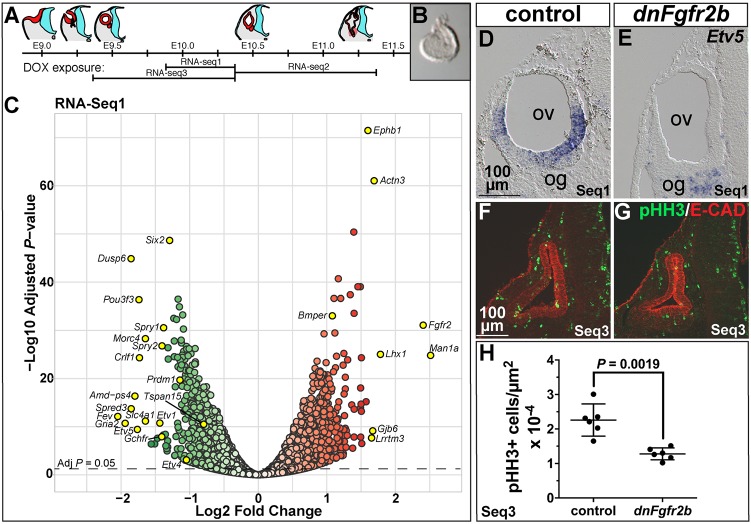
Differential RNA-Seq reveals expected and novel targets of FGFR2b ligands during early otic morphogenesis and their requirement in otic epithelial proliferation. (A) Schematic of otocyst morphogenesis correlated with the three DOX exposures used for RNA-Seq. Red represents otic tissue, blue represents neural tissue. (B) Microdissected E10.25 otocyst. (C) RNA-Seq1 volcano plot showing significantly downregulated (green) and upregulated (red) genes. Significance is plotted on the y-axis and fold-change on the x-axis. Gene labels highlighted in yellow indicate fold-change >1.5, common FGF target genes, and genes pursued for ISH validation. (D,E) Transverse sections of E10.25 control and dnFgfr2b RNA-Seq1 otocysts hybridized with Etv5. (F,G) Transverse sections of E10.25 control and dnFgfr2b RNA-Seq3 otocysts immunostained for pHH3 (green) and E-cadherin (red). (H) Quantification of pHH3-positive cells per otic epithelial area (shown with mean and 95% c.i.) in RNA-Seq3 control and dnFgfr2 otocysts. Scale bars in D,F apply to E,G. og, otic ganglion; ov, otic vesicle.

