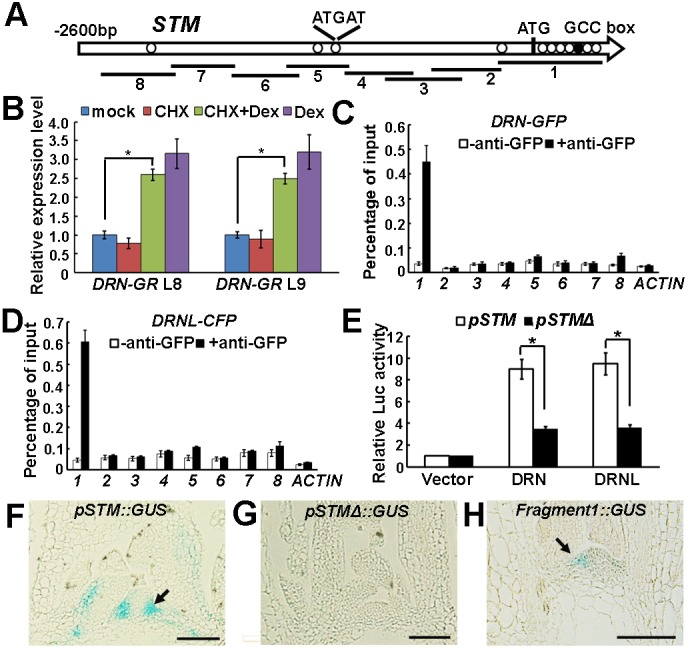
Fig. 5.

DRN and DRNL regulate STM expression via binding to a conserved promoter motif. (A) Schematic representation of the STM genomic region. The black circle and white circles indicate the GCCGCC motif and the ATGAT motif, respectively; ATG denotes the translation start site. Eight PCR fragments were designed for ChIP analysis. (B) RT-qPCR analysis of STM expression using p35S::DRN-GR vegetative shoots (with the leaves removed) before and after simultaneous Dex and CHX treatment for 2 h. The vertical axis indicates the relative mRNA amount compared with the amount in the mock treatment. Error bars indicate the s.d. Two independent transgenic lines were used. *P<0.01 (Student's t-test). (C,D) ChIP-qPCR analysis indicates binding of DRN-GFP (C) and DRNL-CFP (D) to fragment 1. Error bars indicate the s.d. (E) Relative Luc reporter gene expression in transcriptional activity assays in Arabidopsis protoplasts. The 3.0 kb STM promoter region (pSTM) or the same region without fragment 1 (as indicated in A, pSTMΔ) was co-transformed with p35S::DRN or p35S::DRNL, and p35S::GUS was the internal control. Data are mean±s.d. for three independent biological experiments, each performed in triplicate. *P<0.01 (Student's t-test). (F-H) Pattern of GUS expression driven by pSTM (F), pSTMΔ (G) and fragment 1 (H) in longitudinal sections through a vegetative shoot apex of 30-day-old plants. To compare signals, plants were stained in parallel for 6 h, and sections were placed on the same slides for detection. The GUS signal is barely detectable in leaf axils of pSTMΔ::GUS plants (F) but weakly detectable in fragment1::GUS (H). Arrows highlight leaf axils. See Fig. S7 for more examples. Scale bars: 100 μm in F-H.
