Fig. 3.
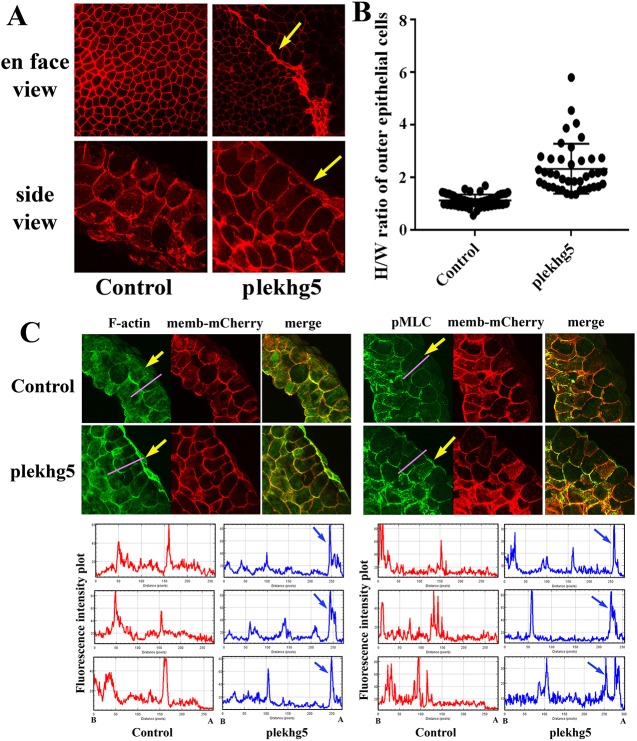
plekhg5 induces cell elongation and apical actomyosin accumulation in outer epithelial cells. (A) En face view of early gastrula embryos shows reduced cell surfaces in plekhg5-expressing cells (arrows) compared with those in control embryos. Side view of the bisected embryos shows elongation of superficial epithelial cells from plekhg5-injected embryos. (B) H/W ratio analysis shows that plekhg5-expressing outer epithelial cells have a significant increase in H/W ratio from 1.2 in control cells to 2.2 in plekhg5-expressing cells. Student's t-test gives P=8.3E-21. (C) plekhg5 stimulates apical accumulation of both F-actin and pMLC. The membrane-mCherry signal is used to label the injected cells. Arrows indicate the apical F-actin and pMLC signals. Fluorescence intensity is measured using ImageJ along the axis indicated by the pink line across the animal regions. The plots for three different biological samples are shown with the apical (A) and basal (B) direction labeled at the bottom. Blue arrows point to the apical enhancement of F-actin and pMLC signals.

