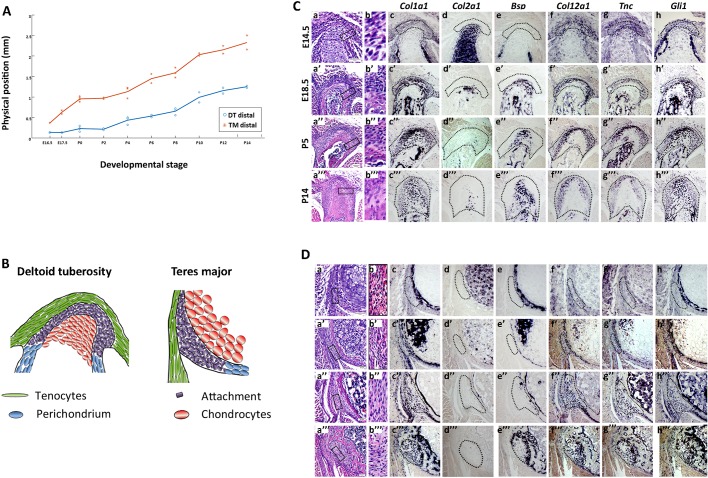
Fig. 1.
Some entheses undergo cellular and morphological changes while migrating. (A) Graph showing the physical position of the DT and TM entheses along the bone throughout development (E16.5-P14), defined as the distance of the element (mm) from a predefined longitudinal origin roughly at the center of the shaft. Positive and negative values correspond to elements that are proximal and distal to the point of origin, respectively. As indicated by the steep slope of the curves, both DT and TM migrate considerably throughout development. (B) Schematics of the embryonic DT and TM entheses. (C,D) Transverse sections through the humerus showing the DT (C) and TM (D) entheses of E14.5-P14 WT mice. (Ca,Cb,Da,Db) H&E staining. Cb and Db are magnifications of the boxed areas in Ca and Da, respectively. (Cc-Ch,Dc-Dh) ISH using DIG-labeled, anti-sense complementary RNA probes for Col1a1, Col2a1, Bsp, Col12a1, Tnc and Gli1 at E14.5 (c-h), E18.5 (c′-h′), P5 (c″-h″) and P14 (c‴-h‴). Dotted line demarcates the enthesis. Scale bars: 50 µm.

