Fig. 7.
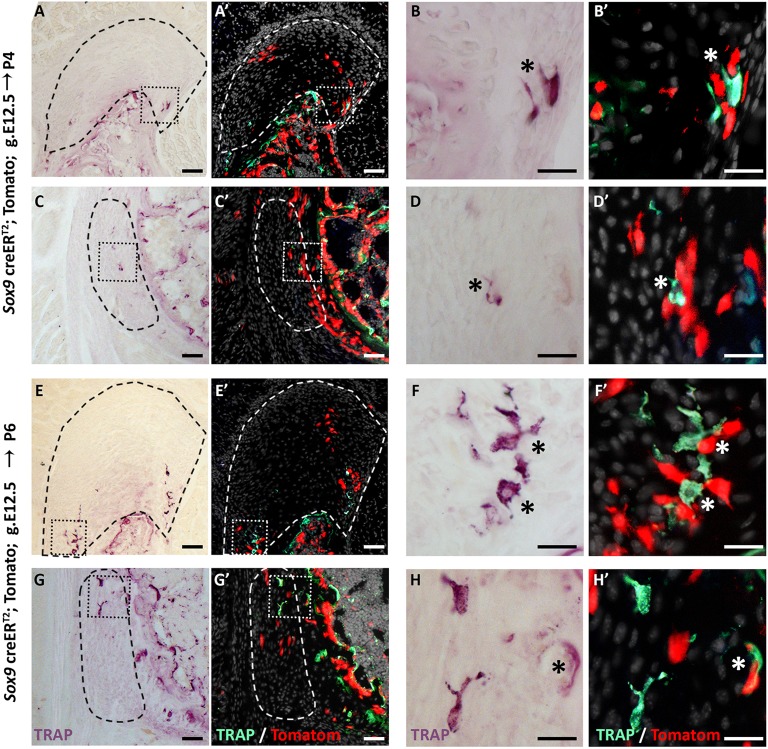
Close spatial proximity between Sox9+ lineage cells and osteoclasts. (A-H′) TRAP staining of P4 and P6 humeri shows osteoclasts (asterisk) in proximity to Sox9+ lineage cells in the DT (A-B′,E-F′) and in the TM (C-D′,G-H′). In A′-H′, TRAP expression images (A,C,E,G) were inverted and overlaid with tdTomato signal from Sox9-CreER;tdTomato lineage cells. B,B′,D,D′,F,F′,H,H′ are magnifications of the boxed areas in A,A′,C,C′,E,E′,G,G′, respectively. Dashed line demarcates the enthesis. Scale bars: 50 µm in A,C,E,G; 20 µm in B,D,F,H.

