Fig. 2.
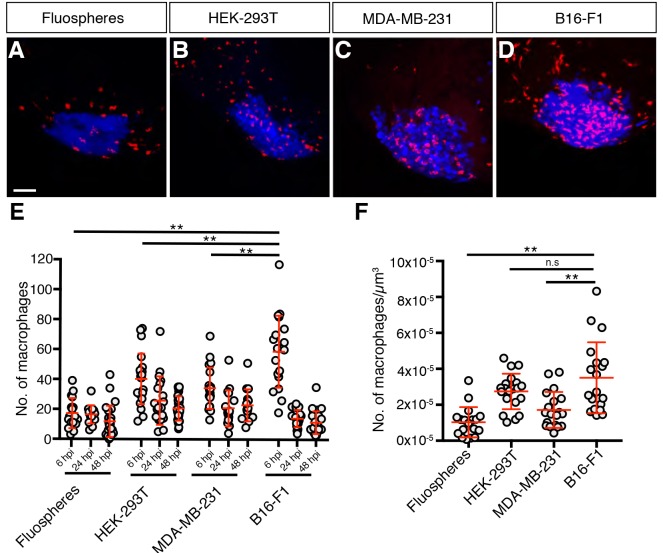
Macrophages are recruited to grafts. (A-D) Confocal images of mpeg1:mCherry-expressing macrophages (red) in zebrafish embryo grafts (blue) at 6 hpi. (E) Quantitation of graft-associated macrophages at 6, 24 and 48 hpi, n>14. (F) Quantitation of graft-associated macrophages normalised for graft volume at 6 hpi, n>16. Error bars represent s.d. n.s, P>0.05; **P<0.01 by one-way ANOVA. Scale bar: 50 µm.

