Fig. 4.
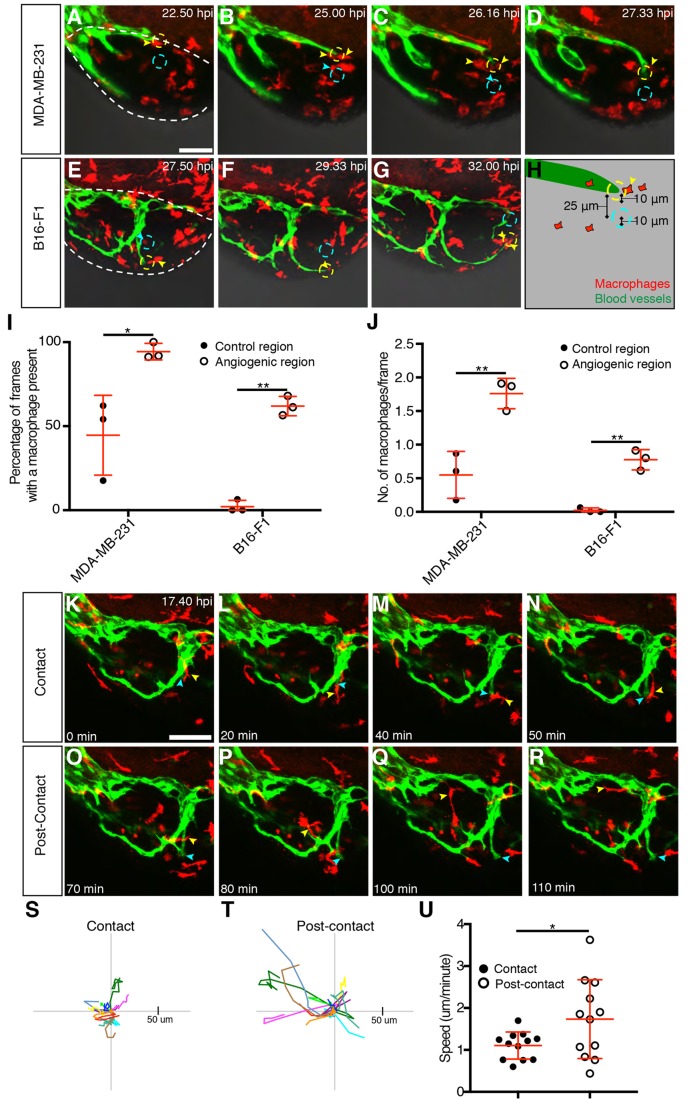
Macrophages associate with developing xenograft vessels. (A-G) Still images showing an MDA-MB-231 xenograft (A-D, Movie 3) or a B16-F1 xenograft (E-G, Movie 4) in an embryo with mpeg1:mCherry-expressing macrophages (red) and kdrl:EGFP-expressing blood vessels (green). Individual macrophages associated with the angiogenic region (yellow dashed circle) are indicated with yellow arrowheads, while macrophages associated with the control region (cyan dashed circle) are indicated with cyan arrowheads. The tumour region is outlined by a white dashed line in A and E. (H) Schematic demonstrating the positioning of the 10-μm angiogenic region (dashed yellow outline) at the tip of the blood vessel (green) and the control 10-μm control region (dashed cyan outline). (I) Quantitation of the percentage of frames during which a macrophage was observed at either an angiogenic region or a control region in MDA-MB-231 and B16-F1 xenografts, n=3. (J) Mean number of macrophages observed during each frame, in either the angiogenic region or the control region, in MDA-MB-231 and B16 F1 xenografts, n=3. (K-R) Still images showing a B16-F1 xenograft (Movie 4) in an embryo with mpeg1:mCherry-expressing macrophages (red) and kdrl:EGFP-expressing blood vessels (green). An individual macrophage (yellow arrowhead) is tracked for 1 h 10 min during (K-N) and after (O-R) associating with the distal tip of a growing vessel (indicated by a cyan arrowhead). (S,T) Macrophage migration tracks of 12 macrophages during their period of contact with the tip of a growing vessel (S) and of the same macrophages once they leave the vessel tip (T). Each macrophage is depicted with the same colour in both S and T and they were tracked for identical periods of time during contact and post-contact. (U) Quantitation of macrophage migration speed during and after the period of contact with the tip of a growing vessel, n=12. Error bars represent s.d. *P<0.05, **P<0.01 by t-test. Scale bars: 50 µm.

