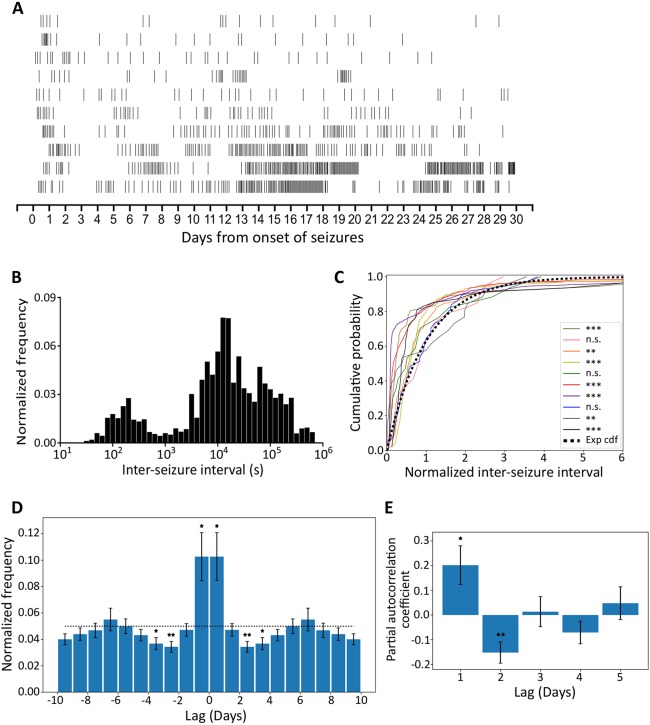
Fig. 5.
Seizures tend to cluster. (A) Raster plots of all seizures from onset of seizures over the whole recording period. (Each row represents the seizure distribution for an individual animal.) (B) Histogram of ISI from ten animals. The frequency was normalised to the total seizures of individual animals. (C) Deviation between individual animals (colour-coded) normalised ISI distributions and the exponential cumulative distribution function (Exp cdf). (Lilliefors-Kolmogorov–Smirnov test, **P<0.01, ***P<0.001, n.s.=not significant.) (D) Autocorrelation function. Data are re-calibrated for a short acquisition period (see Materials and Methods) and presented as mean±s.e.m. The dotted line represents the expected value of a uniform distribution. First-, third- and fourth-day counts differ significantly from the uniform distribution (two-tailed one-sample t-test, *P<0.05, **P<0.01). (E) Partial autocorrelation coefficients for daily seizure counts (mean± s.e.m.). The first and second coefficients differ significantly from zero (two-tailed one-sample t-test, *P<0.05, **P<0.01).

