Fig. 1.
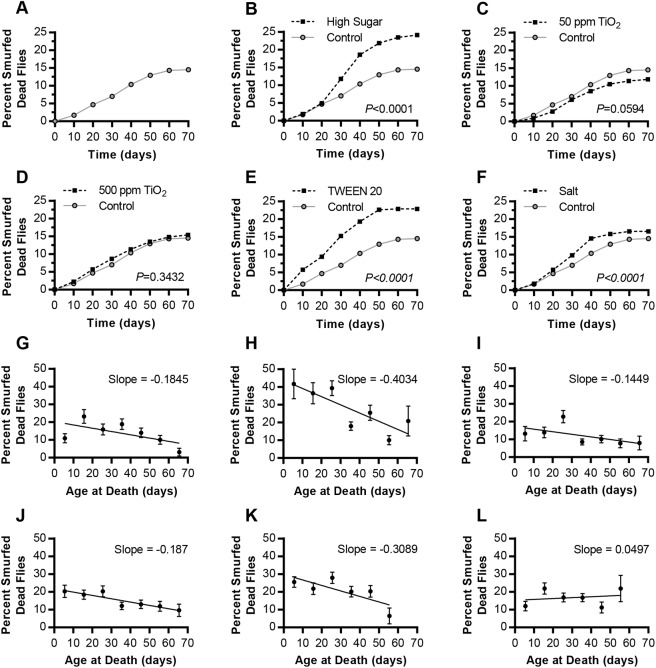
The Smurf phenotype shows increased blue-dye leakage from the gut into the body cavity with dietary supplementation. Dead flies were rinsed and visually scored for the Smurf phenotype. (A-F) The cumulative percentage of flies Smurfed at death. (A) Control diet (0.15 M sucrose; n=945). (B) High-sugar (HS) diet (1.0 M sucrose; P<0.0001, χ2 17.27, d.f.=1; n=797). (C) 50 ppm TiO2 diet (P=0.0594, χ2 3.554, d.f.=1; n=999). (D) 500 ppm TiO2 diet (P=0.3432, χ2 0.8986, d.f.=1; n=1189). (E) 1% TWEEN 20 diet (P<0.0001, χ2 55.55, d.f.=1; n=937). (F) 1% salt diet (P<0.0001, χ2 16.59, d.f.=1; n=949). Each experimental diet was compared with the control diet. P-values calculated using the Mantel–Cox log-rank test in A-F. (G-L) The non-cumulative data representing the percentage of flies who were Smurfed upon death. (G) Control diet. (H) HS diet. (I) 50 ppm TiO2 diet. (J) 500 ppm TiO2 diet. (K) 1% TWEEN 20 diet. (L) 1% salt diet. Error bars represent s.e.m. and the best-fit slope was calculated using a linear regression.

