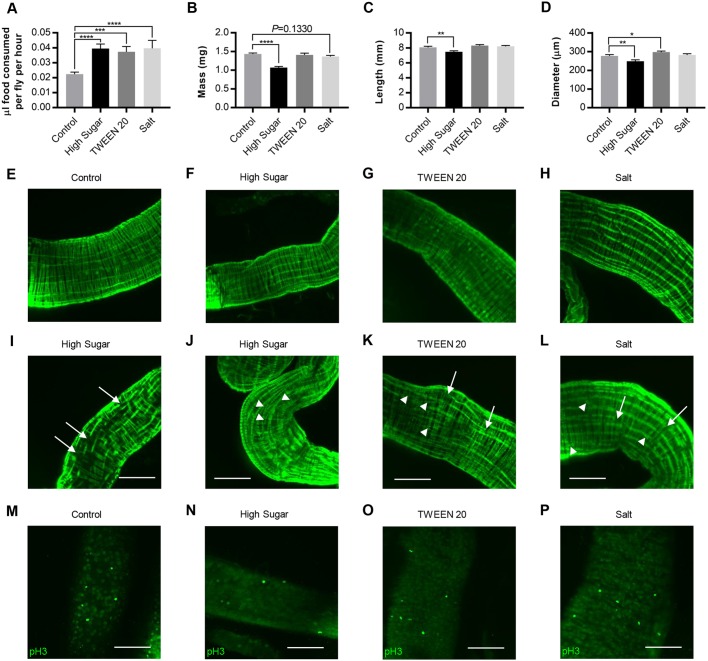
Fig. 5.
The mechanisms by which HS and other additives affect gut function are likely to differ. Females were aged 3 weeks and quantified for various phenotypes. (A) One-hour feeding volume. (B) Fly mass. (C) Midgut length. (D) Midgut diameter at its widest point, found in the posterior midgut. Each diet was compared with control using a Student's two-tailed t-test. Error bars represent s.e.m. *P<0.05; **P<0.01; ***P<0.001; ****P<0.0001. (E-H) Actin cytoskeleton of the posterior midgut, which is usually uniform and exhibits few breaks, dead ends or crossovers. (E) Control diet. (F) HS diet. (G) TWEEN 20 diet. (H) Salt diet. (I-L) Aberrant actin cytoskeletons found in additive guts. Arrows denote broken filaments and arrowheads denote filaments that differ from the typical parallel filament structure. (I) HS, filament breaks. (J) HS, filament disorganization and crossing over. (K) TWEEN 20. (L) Salt. (M-P) Anti-phospho-histone H3 immunoreactivity in posterior midguts. This region typically had 0 or 1 dividing cell per field, although some fields had five or more. (M) Control-fed posterior gut with numerous dividing cells. (N) A HS-fed gut. (O) Dividing cells in a TWEEN-20-fed gut. (P) Dividing cells in a salt-fed gut. Scale bars: 100 µm.

