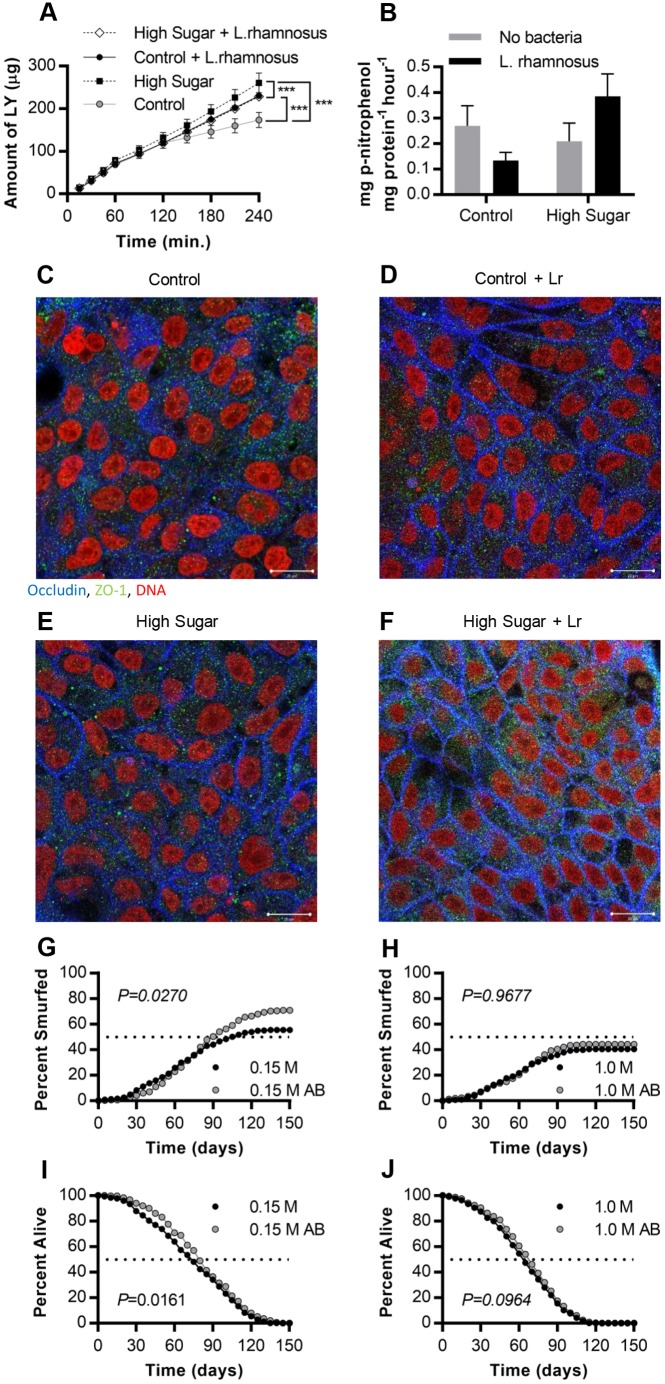
Fig. 6.
The microbiome interacts with sugar to control gut function. (A) Amount of Lucifer Yellow (LY) transferred across the Caco-2/HT29-MTX cell monolayer following exposure to control (5 mM glucose+20 mM mannitol) or high glucose (25 mM glucose; HS) with or without 103 CFU ml−1 L. rhamnosus for 4 h (n=6). ***P<0.0001 using a non-linear fit for a linear model of each sample set. (B) Alkaline phosphatase activity for co-cultures exposed to control or HS and 103 CFU ml−1 L. rhamnosus for 4 h (n=10). (C-F) Confocal images of the in vitro epithelium stained with immunofluorescence for occludin (blue), ZO-1 (green), integral plasma membrane proteins located at the tight junctions, and DNA (red) after 4 h exposure to (C) control (5 mM glucose+20 mM mannitol), (D) control (5 mM glucose+20 mM mannitol) and 103 CFU ml−1 L. rhamnosus (Lr), (E) HS (25 mM glucose), (F) HS (25 mM glucose) and 103 CFU ml−1 L. rhamnosus. Scale bars: 20 µm. (G-J) Adult Drosophila were fed a control or HS diet with or without antibiotics. (G) Cumulative Smurfing in flies fed the control lab diet +/− an antibiotic cocktail for the entire lifespan (P=0.0270, χ2 4.891, d.f.=1; n=314 for control; n=302 for control+antibiotics). (H) Smurfing in flies reared on HS +/− antibiotics (P=0.9677, χ2 0.001644, d.f.=1; n=304 for HS; n=314 for HS+antibiotics). (I) Lifespan after control rearing +/− antibiotics (P=0.0161, χ2 5.792, d.f.=1; n=314 for control; n=302 for control+antibiotics). (J) Lifespan after HS +/− antibiotics (P=0.0964, χ2 2.764, d.f.=1; n=304 for HS; n=314 for HS+antibiotics). Error bars represent s.e.m. P-values were calculated using the Mantel–Cox log-rank test.

