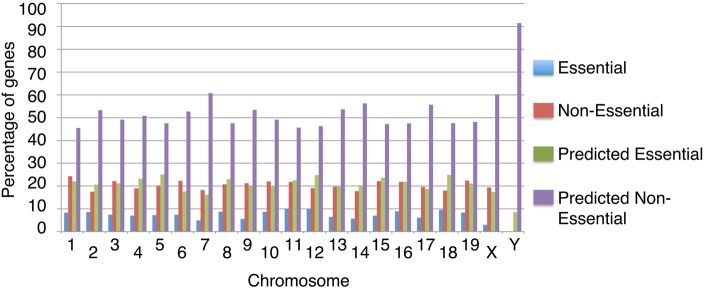
Fig. 4.
The genomic distribution of essential and non-essential mouse genes, separated into known and predicted essentiality. The percentages of essential and non-essential genes on each chromosome are compiled from the MED database. In the genome as a whole, we calculate that there are 28% essential genes and 72% non-essential genes when known and predicted essentiality statuses are combined. Data are provided in Table S8.

