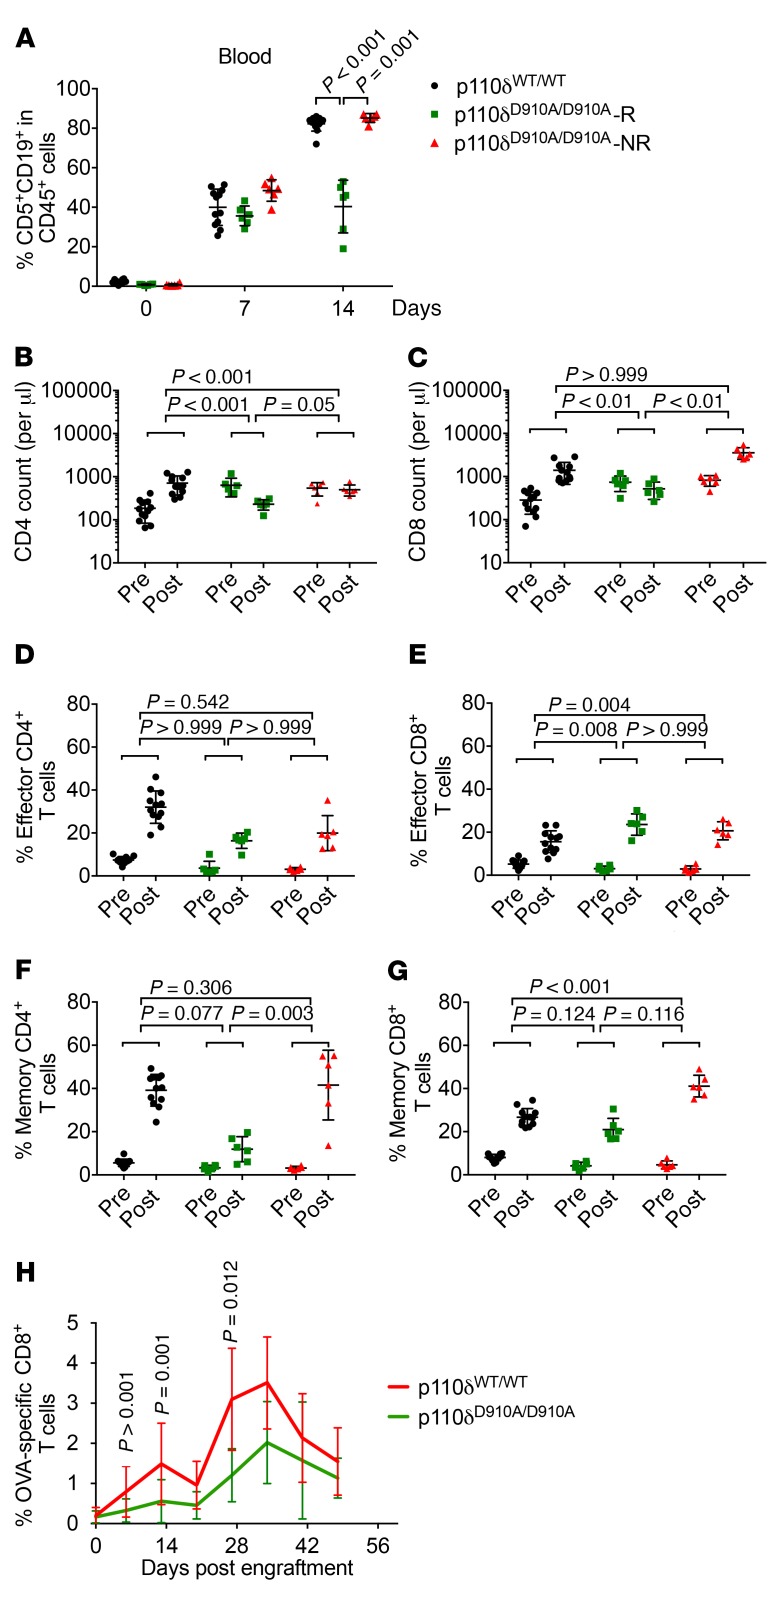
Figure 6. Impact of p110δ inactivation on T cell antileukemia response.
p110δWT/WT and p110δD910A/D910A mice after adoptive transfer with 2 × 10⁷ secondary Eμ-TCL1 leukemia cells. (A) Percentage CD5+CD19+ of CD45+ cells was examined by flow cytometry on days 0, 7, and 14. (B–G) Absolute number of CD4+ T cells (B), absolute number of CD8+ T cells (C), effector CD4+ T cells (percentage CD44loCD62LhiCD4+ of CD4+ cells) (D), effector CD8+ T cells (percentage CD44loCD62LhiCD8+ of CD8+ cells) (E), memory CD4+ T cells (percentage CD44hiCD62LhiCD4+ of CD4+ cells) (F), and memory CD8+ T cells (percentage CD44hiCD62LhiCD8+ of CD8+ cells) (G) were examined before the engraftment (Pre) and day 14 after the engraftment (Post). Black circles, p110δWT/WT; green squares, p110δD910A/D910A-R; red triangles, p110δD910A/D910A-NR. Comparisons were based on separate mixed-effects models (log-transformed data); P values were adjusted using Holm’s procedure. (H) OVA-TCL1 cells were adoptively transferred into p110δWT/WT and p110δD910A/D910A mice; OVA-specific CD8+ T cells were examined weekly using fluorescent tagged OVA tetramer by flow cytometry. Bars represent mean ± SD. (Group comparisons are based on mixed-effects models on log-transformed data; P values were adjusted for multiple comparisons using Holm’s procedure; 9 total time points examined.)

