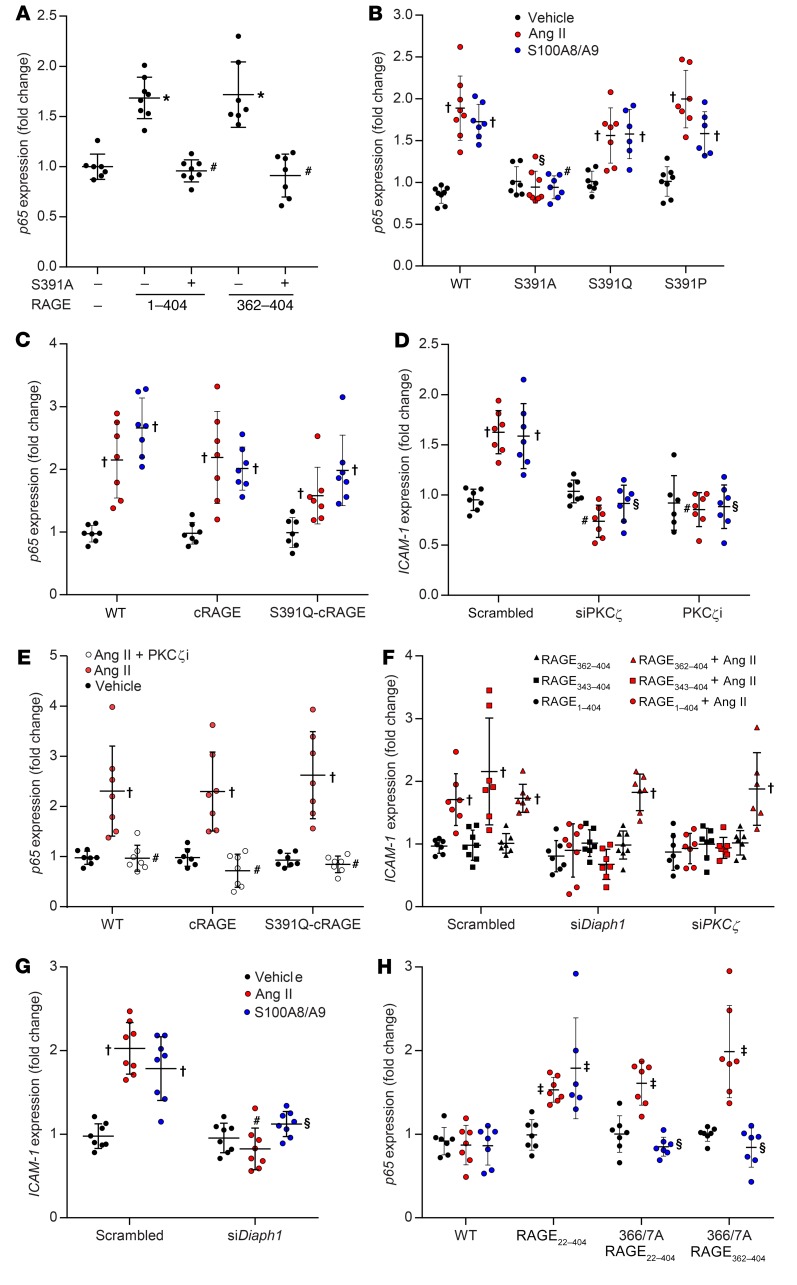
Figure 4. Modulation of proinflammatory signaling induced via RAGE activation by Ang II and/or S100A8/A9.
Treatment with Ang II was at a dose of 1 μM for 2 hours, and treatment with S100A8/A9 was at a dose of 2 μg/ml for 2 hours. (A) Induction of p65 expression in AT1-CHO cells by Ang II in the presence or absence of full-length and N-truncated RAGE constructs in which S391 was mutated to alanine (S391A). (B) Induction of p65 expression in AT1-CHO cells in the presence or absence of full-length RAGE constructs in which S391 was mutated. (C) Induction of p65 expression in AT1-CHO cells in the presence or absence of cRAGE constructs. (D) Induction of ICAM-1 expression in PMAECs in the presence or absence of a siRNA against PKCζ, a PKCζ pseudosubstrate (PKCζi; 5 μM), or a scrambled control. (E) Induction of p65 expression in AT1-CHO cells also expressing WT or cRAGE constructs in the presence or absence of PKCζi. (F) Induction of ICAM-1 expression in HMEC1 in the presence or absence of a siRNA targeting PKCζ or Diaph1 expression, and the rescue of inhibition by RAGE362–404 but not RAGE343–404. (G) Induction of ICAM-1 expression in the presence or absence of a siRNA targeting Diaph1 expression in HMEC1. (H) Induction of p65 expression in AT1-CHO cells in the presence or absence of full-length and N-truncated 366/367A-RAGE constructs. Data are presented as the mean ± SD. n = 6–8 group. *P < 0.05 versus mCherry plus Ang II; #P < 0.05 versus RAGE (transfected into AT1-CHO cells or endogenous in HMEC1) plus Ang II treatment; †P < 0.05 versus vehicle; §P < 0.05 versus RAGE (transfected into AT1-CHO cells or endogenous in HMEC1) plus S100A8/A9; ‡P < 0.05 versus pCINeo plus vehicle. P values were determined by 2-way ANOVA.

