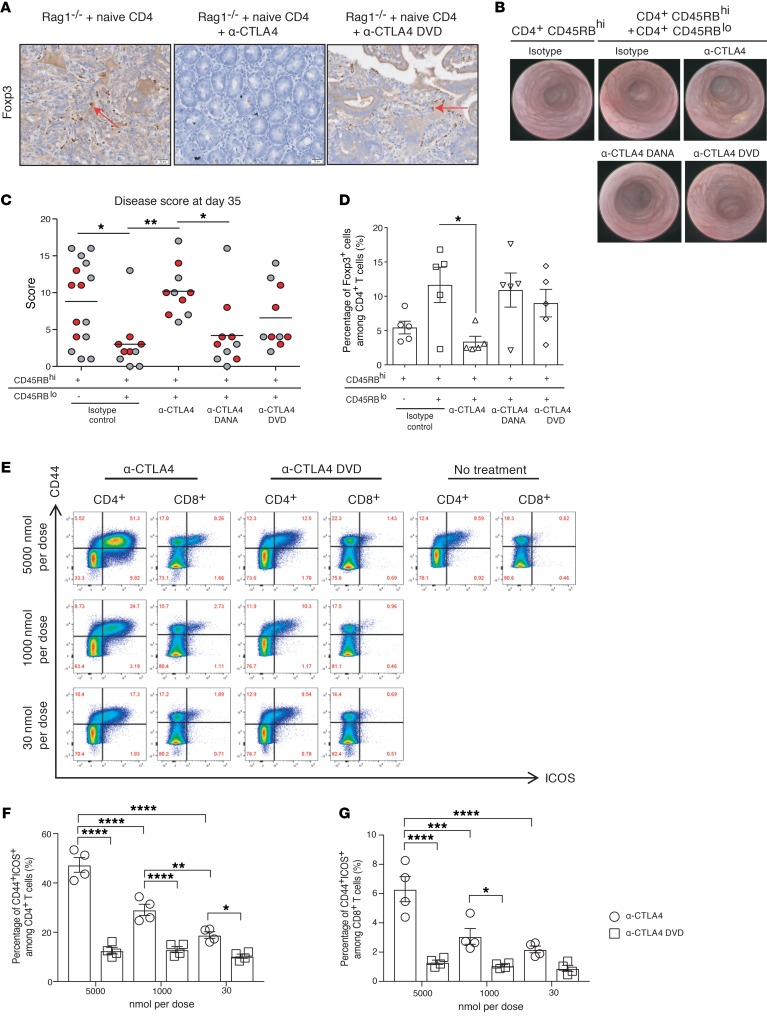
Figure 5. Colitis induction following treatment with anti-CTLA4, but not with anti-CTLA4 DVD.
(A) Foxp3 IHC staining was performed on GI tract tissue sections from mice receiving different Abs. Arrows indicate Foxp3+ cells. Experiments were conducted twice with 6 mice per group, and the representative figure from each treatment arm was shown. (B–D) Recipient C.B17 SCID mice were i.p. injected with 5 × 10⁵ purified CD4+CD45RBhi cells with or without 2.5 × 10⁵ CD4+CD45RBlo cells, and administered the indicated treatments at 200 μg per dose twice per week for 3 weeks. At day 35, all mice were evaluated by endoscopy and scored for colitis. Data were collected from 1 experiment with 10–15 mice per treatment arm. (B) Representative endoscopy images of a single mouse from each group. (C) Graphic representation of endoscopy scores at day 35. Red dots indicate animals from which colons were further analyzed for percentage of Foxp3+ cells among CD4+ cells in D. (E–G) Healthy C57BL/6j mice were injected with either anti-CTLA4 or anti-CTLA4 DVD. (E) Flow-gating strategy of spleen samples. (F) Percentage of CD44+ICOS+ in CD4+ T cell subsets. (G) Percentage of CD44+ICOS+ in CD8+ T cell subsets. For parts E–G, experiments were conducted twice, and the representative data from 1 experiment was from 4 mice per group. Bars represent mean or mean ± SEM. *P < 0.05; **P < 0.01; ***P < 0.001; ****P < 0.0001, 1-way ANOVA with post hoc Tukey’s test.

