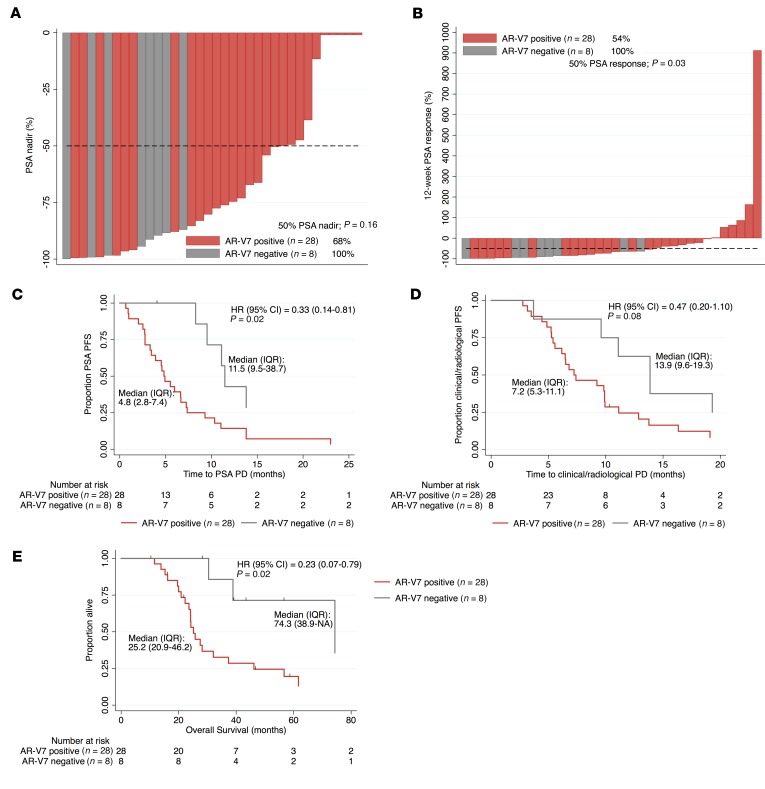
Figure 4. AR-V7 status and response to AR-targeting therapies (AA or E) prior to chemotherapy in CRPC.
Thirty-six patients received AR-targeting therapies (AA or E) prior to chemotherapy for CRPC. (A) Percentage PSA nadir on AR-targeting therapies for AR-V7–negative (H score ≤ 10; gray) and AR-V7–positive (H score > 10; red) CRPC patients is shown. Fifty percent PSA nadir rate is shown. P value was calculated using Fisher’s exact test. (B) Percentage 12-week 50% PSA response rate on AR-targeting therapies for AR-V7–negative (gray) and AR-V7–positive (red) CRPC patients is shown. Twelve-week 50% PSA response rate is shown. P value was calculated using Fisher’s exact test. (C–E) Kaplan-Meier curves show time to PSA progression (C), time to clinical/radiological progression (D), and overall survival (E) from start of AR-targeting therapy. Hazard ratios (HRs) with 95% confidence intervals (CIs) are shown. P value was calculated using univariate Cox proportional hazards model.

