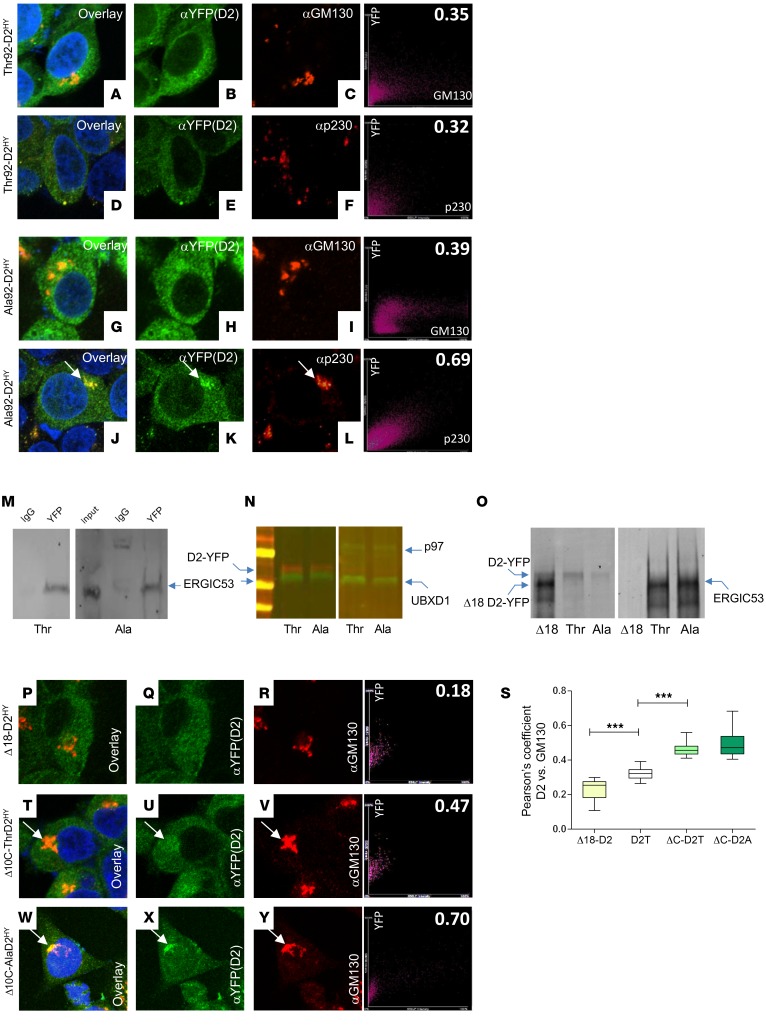
Figure 1. D2 recycles between Golgi apparatus and ER.
(A–F) Immunofluorescence of Thr92-D2HY stably expressing cells using the indicated antibodies. On the far right is the Pearson’s plot for each immunofluorescence image. The right top number is the Pearson’s coefficient for that specific cell. Pearson’s coefficient was calculated as follows: Thr92-DIO2 × α-GM130 (0.32 ± 0.06); Ala92-DIO2 × α-GM130 (0.36 ± 0.07). (G–L) Same as A–F, except that cells stably express Ala92-D2HY. Arrows point to Golgi AlaD2 staining. Pearson’s coefficient: Thr92-DIO2 × α-p230 (0.33 ± 0.05); Ala92-DIO2 × α-p230 (0.65 ± 0.12; P < 0.01 versus Thr92-DIO2 × α-p230). (M and N) Thr92-D2HY (Thr) or Ala92-D2HY (Ala) pulldown, followed by Western blot analysis with the indicated antibodies. (O) Same as M and N, except that cells transiently express Δ18-D2HY. (P–R) Same as A–C except that cells transiently express Δ18-D2HY. (S) Pearson’s coefficient between the indicated D2 proteins and cis-Golgi marker GM130; Δ18-D2 is Δ18-D2HY (P–R). D2T is Thr92-D2HY (A–C). ΔC-D2T is Δ10C-Thr92-D2HY (T–V). ΔC-D2A is Δ10C-Ala92-D2HY (W–Y). (T–Y) Same as A–C, except that cells transiently express Δ10C-Thr92-D2HY or Δ10C-Ala92-D2HY. Original magnification, APO ×60/1.40 oil objective. Values are shown in box-and-whiskers plot indicating median and quartiles. n = 21/group. Statistical analysis used was Mann-Whitney U test in comparison with D2T. ***P ≤ 0.0001.

