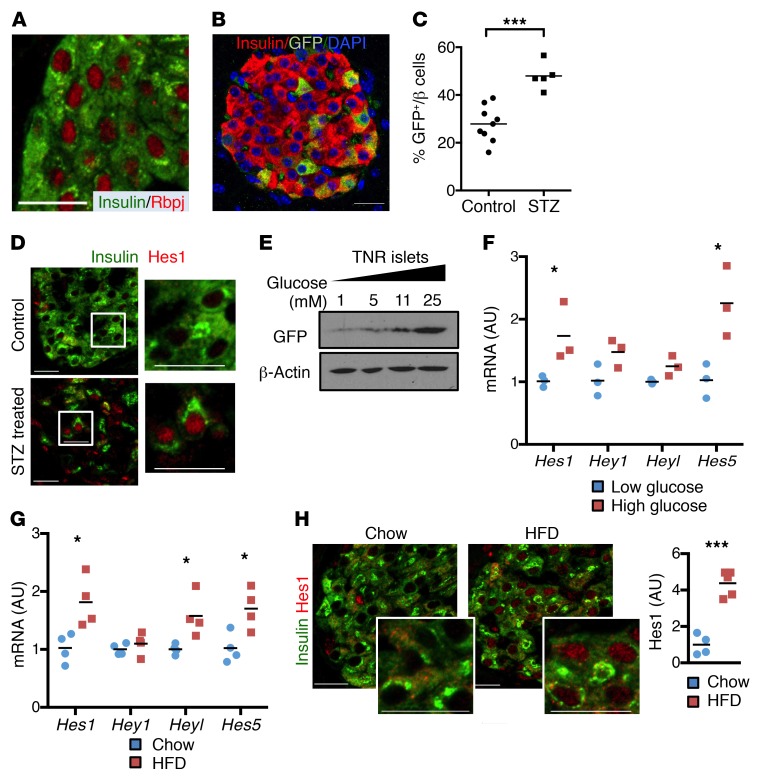
Figure 1. Increased Notch activity with β cell stress.
(A) Representative image of pancreatic sections from WT mice stained with antibodies directed against insulin and Rbpj. (B) Representative image of pancreatic sections from TNR mice. (C) Quantitation of percentage of GFP+ cells in remaining β cells from TNR mice after low-dose STZ (n = 5–9 mice/group). (D) Representative images of pancreatic sections stained with antibodies directed against Hes1 and insulin in vehicle (control) and STZ-treated TNR mice (n = 5–9 mice/group). (E) Western blots from islets isolated from TNR mice, incubated for 15 hours in medium containing indicated glucose concentrations. Representative blots from 2 experiments. (F) Gene expression in islets isolated from WT mice, cultured overnight in medium containing low (1 mM) or high (25 mM) glucose (n = 3 biologic replicates). (G) Gene expression in islets isolated from 24-week HFD-fed WT mice, as compared with normal chow diet–fed littermate controls (n = 5 mice/group). (H) Representative images of pancreatic sections stained with antibodies directed against Hes1 and insulin, with quantitation of nuclear Hes1 fluorescence intensity in β cells (n = 4–5 mice/group). Scale bars: 20 μm. All data are shown with group means. *P < 0.05; ***P < 0.001, 2-tailed t test.

