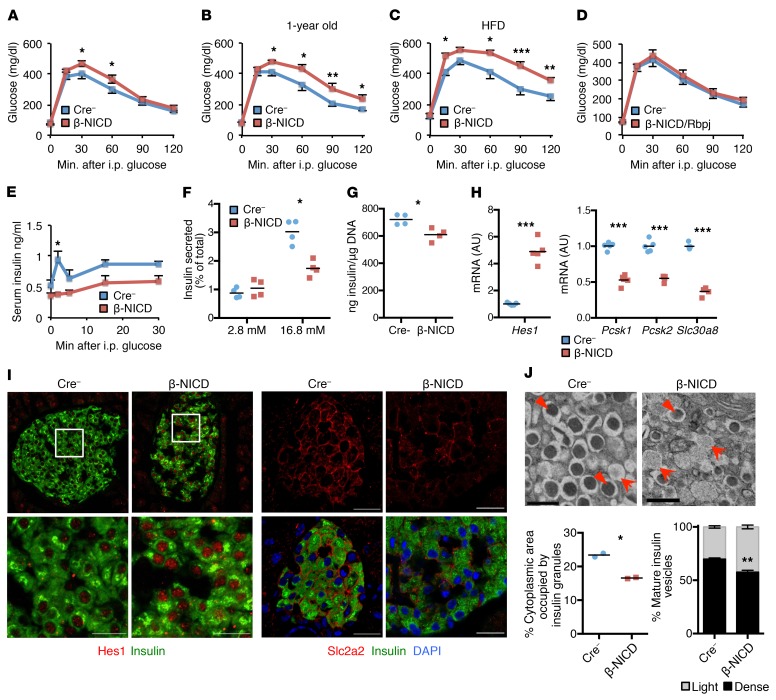
Figure 2. β Cell Notch activation prevents normal GSIS, leading to glucose intolerance.
(A) GTT in chow-fed, adult β-NICD, and Cre– control mice (n = 7–8 mice/group). (B) GTT in chow-fed, 1 year-old β-NICD mice and Cre– control mice (n = 7–8 mice/group). (C) GTT in β-NICD and Cre– control mice fed HFD for 8 weeks (n = 8–10 mice/group). (D) GTT in chow-fed, adult β-NICD/Rbpj and Cre– control mice (n = 7 mice/group). (E) Plasma insulin postintraperitoneal glucose injection in chow-fed β-NICD and Cre– control mice (n = 5 mice/group). (F) GSIS in islets isolated from β-NICD and Cre– control mice, adjusted for islet insulin content (n = 4 mice/group). (G) Insulin content in islets isolated from β-NICD and Cre– control mice, adjusted for islet DNA content (n = 4 mice/group). (H) Gene expression in islets isolated from chow-fed β-NICD and Cre– control mice (n = 5 mice/group). (I) Representative images of pancreatic sections from β-NICD and Cre– control mice stained with antibodies directed against Hes1 (left) or Slc2a2 (right) (n = 5 mice/group). Scale bars: 20 μm. (J) Representative electron micrographs from 1-year-old β-NICD mice and Cre– control mice (top). Arrows represent immature vesicles, and arrowheads show mature vesicles. Scale bars: 500 nm. Quantitation of mature (over total) dense-core insulin vesicles (bottom left) and cytoplasmic area occupied by insulin vesicles (bottom right) (n = 2 mice/group). All data are shown with group means ± SEM. *P < 0.05; **P < 0.01; ***P < 0.001, 2-tailed t test.

