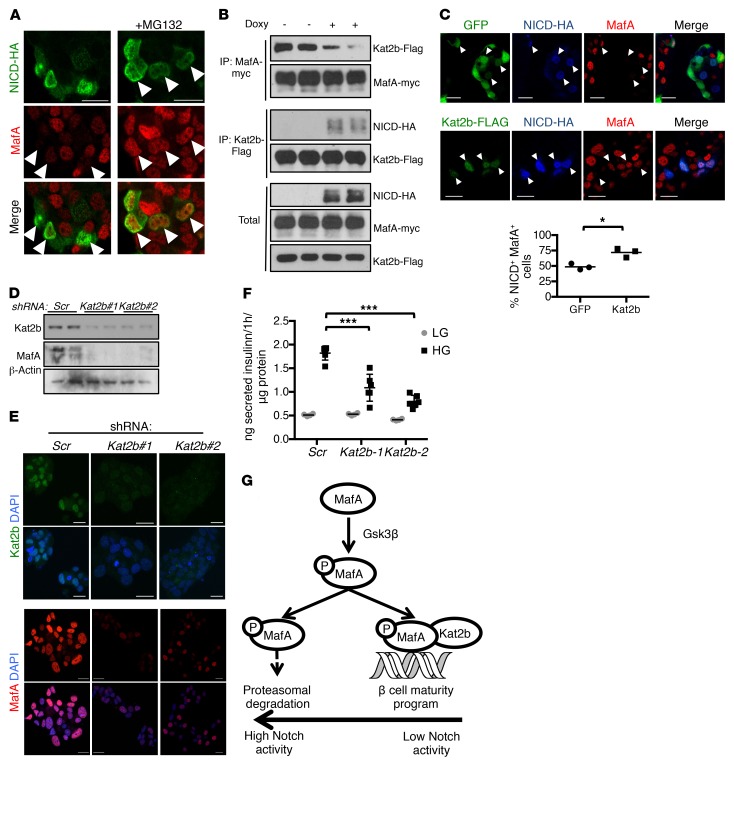
Figure 4. Notch causes MafA degradation by preventing its association with Kat2b.
(A) Representative immunofluorescence images of fixed MIN6 cells transiently transfected with NICD-HA, with or without MG132 (n = 4 independent experiments). (B) Western blots from immunoprecipitates derived from 293T cells with stable integration of the rTTA3 transcriptional transactivator, transfected with MafA-myc, Kat2b-Flag, and Tet-On NICD-HA, with or without stimulation with doxycycline for 4 hours. (C) Representative images of immunofluorescence of fixed MIN6-rTTA3 cotransfected with Tet-On NICD-HA and GFP or Kat2b-Flag after stimulation with doxycycline for 8 hours, and quantitation of percentages of NICD+GFP+ or NICD+Kat2b+ (arrowheads) cells with detectable MafA (n = 3 independent experiments, ~250 cells analyzed per sample). *P < 0.05, 2-tailed t test. (D) Western blots from MIN6 cells transduced with lentivirus encoding shRNA targeting Kat2b (2 different sequences: Kat2b#1 and Kat2b#2) or scrambled control (Scr). (E) Immunofluorescence images of fixed MIN6 cells transduced with lentivirus encoding shRNA targeting Kat2b or scrambled shRNA (Scr). Representative images from 2 independent experiments. (F) GSIS from MIN6 cells transduced with lentivirus encoding shRNA against Kat2b or scrambled control in medium containing low (1 mM, LG) or high (25 mM, HG) glucose. Results from a representative experiment with 6 replicates per condition. Experiment was performed 3 times. ***P < 0.001, 1-way ANOVA and Dunnett’s multiple comparisons post hoc test. (G) Model of Notch regulation of MafA-Kat2b interaction and MafA proteasomal degradation. Scale bars: 20 μm. All data are shown with group means.

