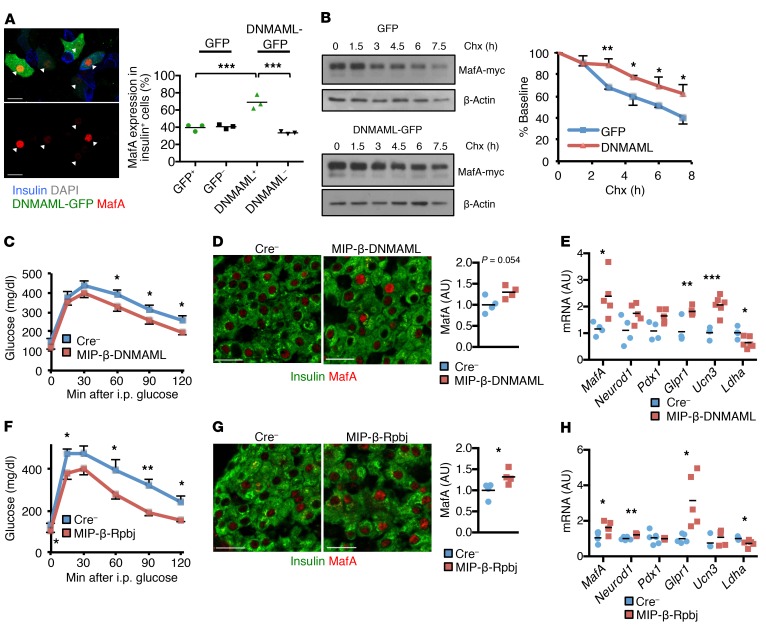
Figure 7. Notch loss of function stabilizes β cell MafA and improves glucose tolerance.
(A) Representative image of islet cells dispersed from WT mice transduced with lentivirus expressing DNMAML-GFP (or GFP control) and exposed to 100 nM palmitate and 25 mM glucose for 72 hours. Arrows indicate DNMAML+ cells. Quantitation shows insulin+ MafA+ islet cells in transduced vs. nontransduced cells (n = 3 independent experiments). ***P < 0.001, 1-way ANOVA and Dunnett’s multiple comparisons post hoc test. (B) Western blots and quantitation of residual MafA-Myc signal expressed as percentage of baseline from MIN6 cells with stable integration of DNMAML-GFP (or GFP control) transiently transfected with MafA-myc, then treated with 10 μg/ml cycloheximide (Chx) for the indicated times (n = 3 independent experiments). *P < 0.05; **P < 0.01, 2-tailed t test. (C) GTT in TAM-treated, HFD-fed MIP-β-DNMAML and Cre– control mice (n = 9–11 mice/group) per experimental protocol shown in Supplemental Figure 8C. *P < 0.05, 2-tailed t test. (D) Representative images and quantitation of MafA fluorescence intensity in pancreatic sections from HFD-fed MIP-β-DNMAML and Cre– control mice (n = 4 mice/group). P = 0.054, 2-tailed t test. (E) Gene expression in islets isolated from HFD-fed MIP-β-DNMAML and Cre– control mice (n = 4–5 mice/group). *P < 0.05; **P < 0.01; ***P < 0.001, 2-tailed t test. (F) GTT in HFD-fed MIP-β-Rbpj and Cre– control mice (n = 9 mice/group). *P < 0.05; **P < 0.01, 2-tailed t test. (G) Representative images and quantitation of MafA fluorescence intensity in pancreatic sections from HFD-fed MIP-β-Rbpj and Cre– control mice (n = 4 mice/group). *P < 0.05, 2-tailed t test. (H) Gene expression in islets isolated from HFD-fed MIP-β-Rbpj and Cre– control mice (n = 5–6 mice/group). *P < 0.05; **P < 0.01, 2-tailed t test. Scale bars: 20 μm. All data are shown with group means ± SEM.

