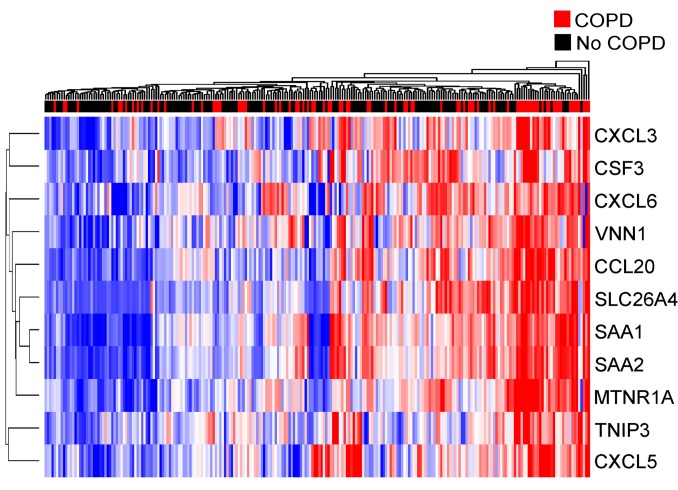
Figure 2. Hierarchical clustering of the 11 IL-17 signature genes in the BAE data set (n = 237).
Signature genes are shown in rows across participants in columns. Blue and red indicate low and high relative gene expression, respectively. Smokers with and without COPD are indicated by red and black, respectively, in the above color bar. Clustering across participants and genes was done by Euclidean distance with average linkage.

