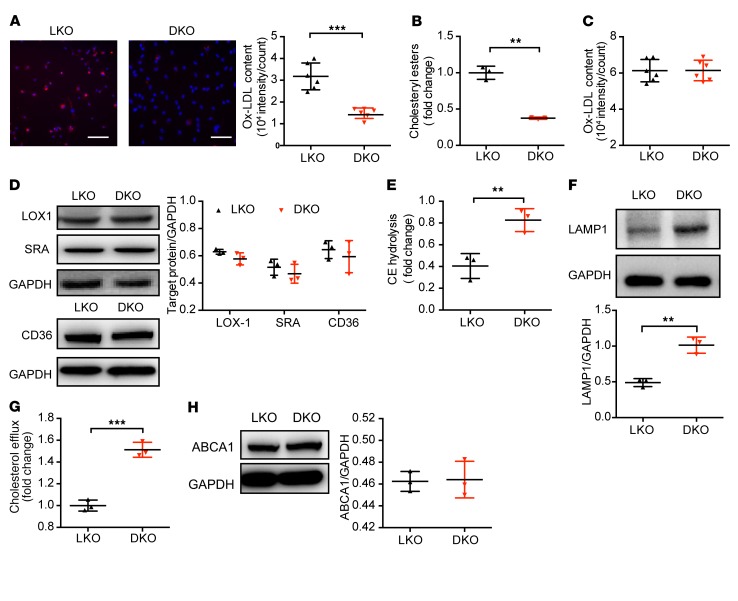
Figure 2. ALDH2/LDLR-DKO macrophages exhibit decreased foam cells compared with LDLR-KO macrophages through restoring the lysosomal function and increased CE hydrolysis, without affecting ox-LDL binding and ABCA1 expression.
(A) ALDH2-KO decreases foam cell formation in LDLR-KO (LKO) BMDMs. Quantification is also shown (n = 6). The ox-LDL signals are shown in red and Hoechst signals are shown in blue. Scale bar: 100 μm. (B) CE decreased in ALDH2/LDLR-DKO (DKO) BMDMs compared with LKO macrophages (n = 3). (C) Binding to ox-LDL in LKO and ALDH2/LDLR-DKO BMDMs (n = 6). (D) Expression of LOX1, SRA, and CD36 in LKO and ALDH2/LDLR-DKO BMDMs (n = 3). (E) CE hydrolysis significantly increased in ALDH2/LDLR-DKO BMDMs compared with LKO macrophages (n = 3). (F) Expression of lysosome function marker LAMP1 in LDLR-KO and ALDH2/LDLR-DKO macrophages (n = 3). (G) Cholesterol efflux increased by ALDH2-KO in LDLR-KO BMDMs (n = 3). (H) ABCA1 expression in LKO and DKO BMDMs (n = 3). Statistical comparisons were made using 2-tailed Student’s t test. All data are mean ± SD. **P < 0.01, ***P < 0.001.

