Figure 2.

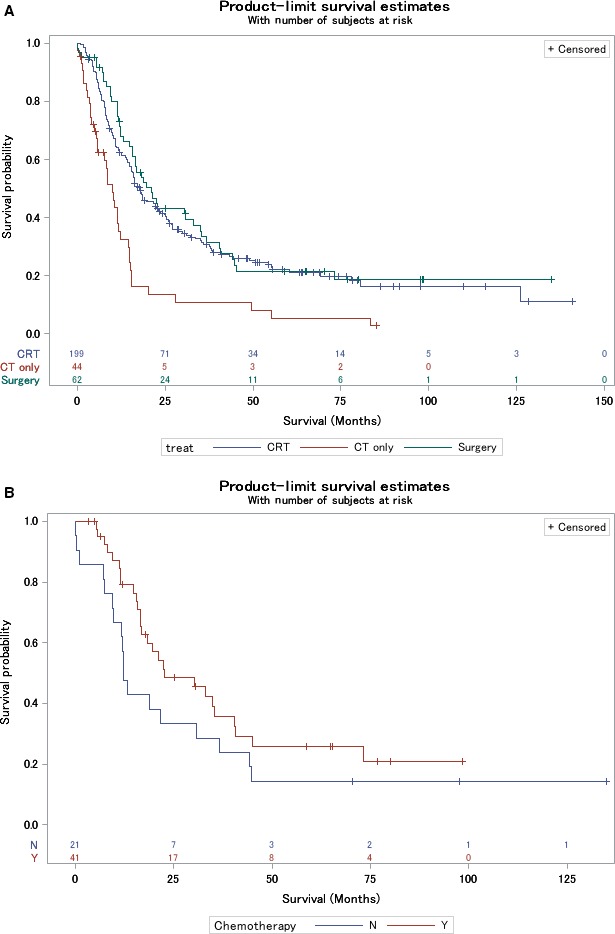
Kaplan‐Meier overall survival curves comparing surgery‐based treatment, chemoradiotherapy, and chemotherapy alone (A). Kaplan‐Meier overall survival curves of the surgery cohort stratified for delivery of additional chemotherapy (B)

Kaplan‐Meier overall survival curves comparing surgery‐based treatment, chemoradiotherapy, and chemotherapy alone (A). Kaplan‐Meier overall survival curves of the surgery cohort stratified for delivery of additional chemotherapy (B)