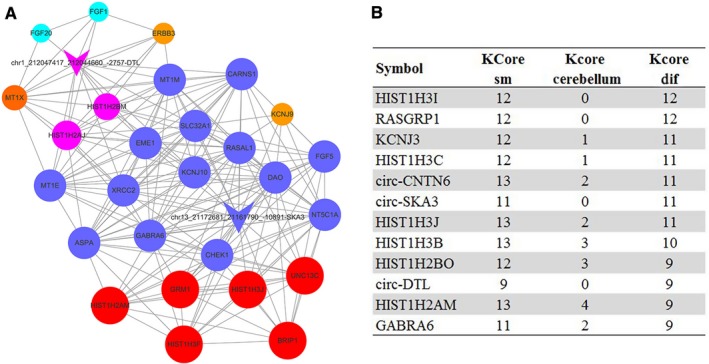
Figure 2.

The coexpression network of gene and circRNAs. A, The coexpression network of circ‐SKA3 and circ‐DTL and related mRNAs as drawn via k‐core analysis. The circ‐SKA3 and circ‐DTL were the two circRNAs that gained the greatest k‐core difference in the network. B, The k‐core difference was calculated to identify the core gene and circRNAs in the medulloblastoma group
