Figure 3.

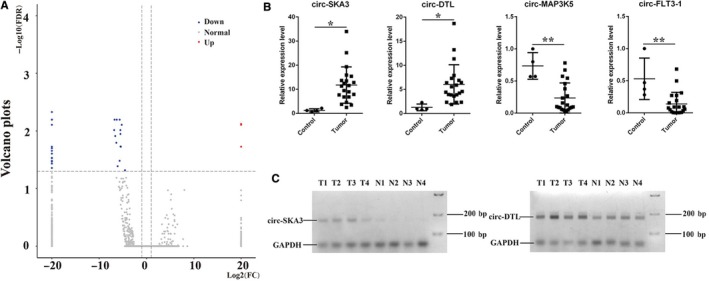
Differentially expressed circRNAs in medulloblastoma (MB). A, Volcano plot shows differentially expressed circRNAs with statistical significance. The vertical dotted lines represent 2.0‐fold change up and down. The horizontal dotted line corresponds to an FDR value of 0.05. The red points in the plot represent upregulated circRNAs, the blue points represent the downregulated circRNAs, and the gray points represent the normal circRNAs. B, The relative expression of circRNAs in MB and normal cerebellum tissues detected using qRT‐PCR. C, RT‐PCR gels show that circ‐SKA3 and circ‐DTL are enriched in MB. *P < .05, **P < .01
