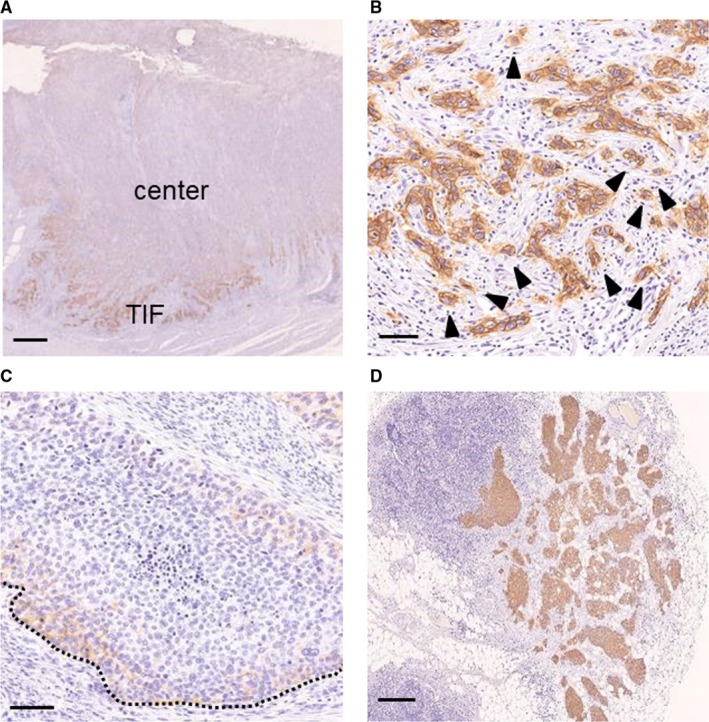
Figure 2.

Representative immunohistochemical analyses of CD44v9. (A) CD44v9 expression in whole tumor section. CD44v9 expression was higher at the TIF compared with the center of the tumor. (B) Strong CD44v9 expression at the TIF in the EMT group. (C) CD44v9 expression in mLNs in the same patient as panel (A). (D) Weak CD44v9 expression at the TIF in the non‐EMT group. CD44v9 expression was higher in the EMT group compared with the non‐EMT group and higher at the TIF and mLNs compared with the whole primary tumor section. The dotted line indicates the TIF and black arrows indicate budding tumor cells. Scale bars: (A) 1 mm, (B, C) 100 µm, and (D) 500 µm. EMT, epithelial‐mesenchymal transition; mLN, metastatic lymph node; TIF, tumor invasive front
