
Figure 2.
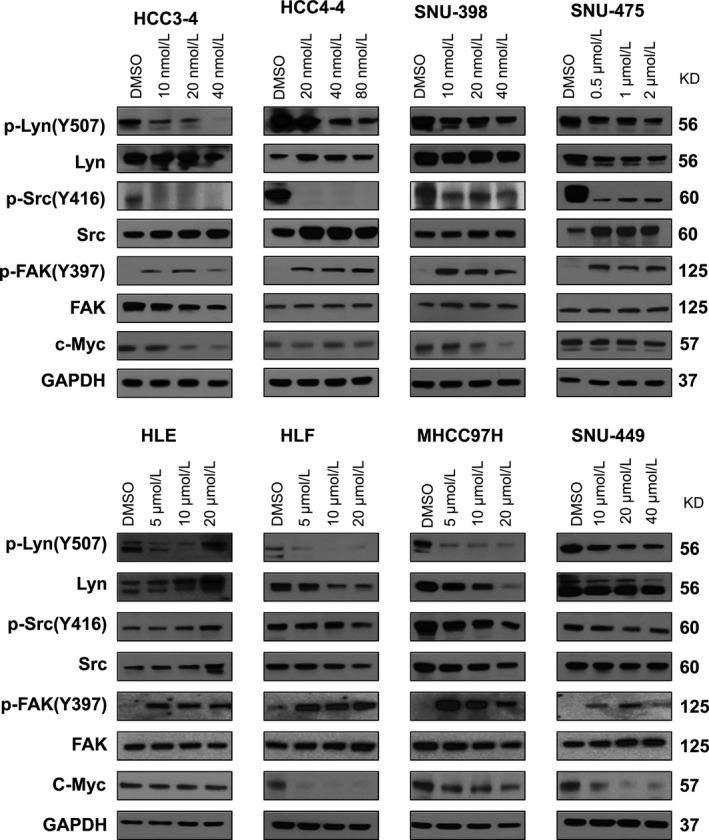
Molecular analysis of Dasatinib treated HCC cell lines. HCC3‐4, HCC4‐4, SNU‐398, SNU‐475, HLE, HLF MHCC97H, and SNU‐449 cells were treated with Dasatinib at IC50 concentration, and expression of c‐Myc, p‐Lyn, Lyn, p‐Src, Src, p‐FAK and FAK was analyzed using Western blotting. GAPDH was used as loading control