
Figure 7.
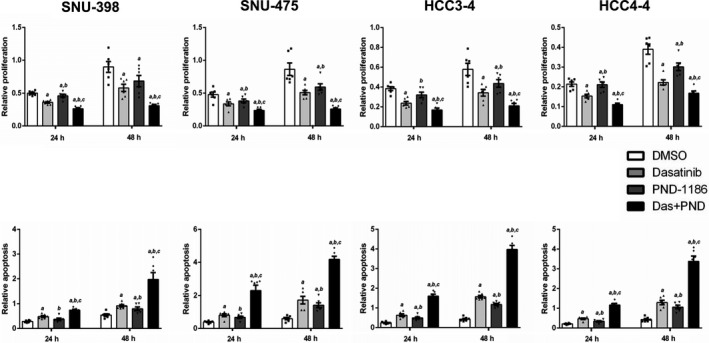
Relative proliferation and apoptosis after Dasatinib, PND‐1186 or Dasatinib and PND‐1186 treatment at different time courses (24 and 48 h) in four HCC cell lines (SNU‐398, SNU‐475, HCC3‐4 and HCC4‐4). Cell proliferation rate was determined using the BrdU Cell Proliferation Assay; whereas cell apoptosis rate was analyzed using the Cell Death Detection Elisa Assay. Upper panels: proliferation; lower panels: apoptosis. Data are presented as mean ± SD. Mann‐Whitney U test, P < 0.05 (a) vs DMSO; (b) vs Dasatinib; (c) vs PND‐1186. See Table S4 for the specific P values for each comparison. Each dot represents one treatment replicate